
Beyond Intelligence: Benchmarking Speed and Cost of Self-Hosted vs. Frontier LLMs
Written by
June 26, 2026
|
Approximately a 00 minutes read
Platform
GLM-5.1 on Intility Inference responds in under a tenth of a second and is 6× cheaper per request. GPT-5.5 streams slightly faster and is the smarter model. We measured speed and cost so you know where the trade-offs actually land.
Most LLM benchmarks answer a very familiar question:
Which model is the smartest?
But in production, model intelligence is only one part of the story. Once LLMs move into real workflows like chat interfaces, RAG pipelines, support workflows, security analysis and operational tooling, other questions become just as important:
- How quickly does the model respond?
- Where is the request processed?
- What happens under concurrent load and how stable is the serving layer?
- What does it cost when usage moves beyond experimentation?
At that point, latency and token costs are no longer side notes, but become part of the architecture. So we built a benchmark for the things we wanted to measure cleanly: speed and cost.
Why latency matters
When you’re testing a model by hand, latency doesn't feel like a big deal. You send a prompt, wait a bit, get an answer, and move on.
But that changes when the model becomes part of a workflow people use all day. A chat interface needs to feel alive. A summarization job needs to finish inside its processing window. An agent loop that calls a model twenty times does not get to ignore the latency of each step.
For Intility, there is also a clear operational angle. We operate environments where timing matters; incidents, alerts, security events, infrastructure changes, and support workflows. In this context, response time is not just a UX detail but can seriously affect how useful the tool is in practice.
Why cost matters too
LLM cost used to be hidden inside experiments, but that phase is ending.
Enterprise customers are starting to see token usage as a visible part of the technology cost base. A few test prompts are cheap, but a chat interface used by hundreds or thousands of employees every day is different. So is document processing, support automation, code assistance or a RAG service that runs continuously.
The models
The current benchmark compares two model backends:
- GPT-5.5 on Azure AI Foundry in the EU data zone
- GLM-5.1 * on Intility-operated infrastructure in Norway
*As this article was being finalized, the open weights of GLM-5.2 was released. Read more in the "Looking ahead" chapter.
Both expose a Chat Completions-style API, but operationally they are very different. The Azure-hosted model gives us access to a state-of-the art frontier model through a public cloud service in a European region. GLM-5.1 runs on Intility-operated Sovereign infrastructure in Norway.
That gives us a different level of control over placement, queueing, capacity and data locality. It doesn't automatically make one option better than the other, but it does make the trade-off measurable. For some workloads, a hosted frontier model is the right choice. For others, running an open-weights model on infrastructure we control gives a cleaner sovereignty story and a more predictable operating model.
One more detail on the Azure side: our GPT-5.5 deployment uses the DataZoneStandard SKU, which routes inference traffic within the EU data zone but does not guarantee processing in a specific region. Based on capacity availability, requests are most likely handled in Sweden Central, but they could also be served from other EU regions such as France, Germany, or the Netherlands. This is a deliberate choice: DataZoneStandard gives us EU data zone compliance and higher default quotas than a region-locked Standard deployment, at the cost of less regional certainty. It also means the latency path to GPT-5.5 is not fixed, it depends on where Azure routes each request. Read more.
Reasoning is turned off
Reasoning mode is deliberately disabled for this benchmark. Not because reasoning is uninteresting (it's very interesting!). It just measures something else.
Most production traffic we see is not “think for a long time and solve a hard problem”. It's shorter, more operational and more repetitive: summarize this, rewrite that, answer this question, generate this snippet, classify this event or explain this change.
For those workloads, we care about the normal streaming path:
- How quickly does the model start responding?
- How fast does it stream (throughput / tokens per second)?
- How does it behave under concurrent load?
- What does the request cost?
Turning reasoning off gives us a cleaner baseline for that comparison. It also keeps cost easier to reason about (no pun intended). Reasoning modes can consume additional tokens or compute in ways that are not always obvious from the final answer. That may be worth it for high-value tasks, but it should be measured separately.
What we measure
We could have timed a handful of prompts by hand. That falls apart the moment you want it to be repeatable: the same prompts, under the same conditions, hundreds of times, against more than one backend, with every number landing somewhere you can query later. So we built a benchmarking application instead. It's deliberately boring in the places that should be boring (no clever sampling, no model grading another model) and precise in the places that matter (every timing measured to the millisecond from where the request actually originates).
A single request travels through three parts: a runner that talks to the models, a small API that stores what comes back, and a dashboard that turns the raw rows into the charts you see in this article.
The runner is a Python program built on asyncio. It walks a matrix of every model, every task category, every repetition, and every concurrency level, and issues the requests for each combination. It talks to the GLM endpoints on Intility Inference with httpx.AsyncClient over their OpenAI-compatible API, and to Azure through the official AsyncAzureOpenAI SDK, so each backend is exercised exactly the way a real application would reach it. Every response is streamed and consumed chunk by chunk. The first content chunk starts the time-to-first-token clock (time.perf_counter, millisecond precision); generation time runs from the first token to the last; tokens per second is simply output tokens over that generation window.
A few details keep the numbers honest. A hard 180-second wall-clock timeout kills any stuck stream, so one hung request can never poison a distribution. Network errors before the first token get retried with backoff, but only while no tokens have arrived, so a retry never double-counts a partial answer. Requests run through asyncio.gather behind a per-cell semaphore, not a sequential loop wearing a wig (when we say concurrency 10, ten requests are genuinely in flight). Multi-turn conversations stay inside a single slot so the context grows turn by turn the way a real chat does, and every turn is timed on its own. And because a full run takes about an hour, every completed call is appended to a checkpoint file as it finishes, so a crash partway through never throws away the work already done.
Each call becomes one row: the model, the prompt, the task category, the concurrency level, the repetition, the turn index and turn count, the three timing numbers, tokens per second, input and output token counts, the computed cost, the finish reason, and the error state if there was one.
Storage and the API
When a run finishes, the runner POST it as JSON to a small Go service (standard-library net/http, pgx to Postgres). That service writes the run-level metadata and every individual request row into two Postgres tables. Nothing is pre-aggregated and, importantly, no percentiles are stored. The database holds raw measurements and only raw measurements.
The dashboard is a React application that reads a run back through the API and computes everything you see in the below results: the p50, p95, and p99, the per-category and per-concurrency breakdowns, and the cost, in the browser from those raw rows.
The benchmarking application focuses on four metrics:
Time to first token
Time to first token is the time from sending the request until the first streamed content arrives.
Low time to first token helps in workflows where the model sits in the path of active work: agent loops, incident analysis, developer tools, support workflows, RAG systems, and document-processing pipelines. If output starts quickly, the rest of the workflow can keep moving instead of waiting for the full response.
This is the “is this thing alive?” metric.
Tokens per second
Tokens per second / throughput measures generation speed after the first token.
This matters for longer responses: code generation, summaries, documentation, long-form answers and agent outputs. A model can be slightly slower to start but still better for long responses if it streams much faster once it gets going.
End-to-end latency
End-to-end latency is the full request duration, from request sent to stream closed.
We look at p50, p95 and p99. Median latency shows the normal case. p95 and p99 show the tail, which is where production systems get interesting.
Cost
Cost is calculated from the actual input and output tokens for each request.
The benchmarking tool is configured to shows cost per 1,000 requests by task category. That makes the numbers easier to map to real workloads, rather than talking about abstract token prices.
The prompt set
We use five categories:
- Factual Q&A - short prompts with short answers
max_tokens 400
Short factual questions, expected output ~30–80 tokens.

System prompt
You are a concise assistant. Answer the user's question in one or two short sentences. Do not add filler.
User prompts (10)

  qa_001
What is the capital of Norway, and roughly how many people live there?

  qa_002
Who wrote 'A Doll's House' and in what decade was it first staged?

  qa_003
In one sentence, what is the difference between TCP and UDP?

  qa_004
What is the largest planet in our solar system, and what is it mostly made of?

  qa_005
Briefly: what does HTTP status code 429 mean, and when do servers return it?

  qa_006
What is the chemical symbol for gold, and roughly when was it discovered?

  qa_007
What language do people speak in Brazil, and why is it different from the rest of Latin America?

  qa_008
In one sentence, what is a hash function used for in software engineering?

  qa_009
Who painted the Mona Lisa, and in which museum is it currently displayed?

  qa_010
Briefly: what does it mean for a function to be 'pure' in functional programming?- Code generation - longer outputs where streaming speed matters
max_tokens 2000
Write a small, self-contained piece of code. ~500–1000 token output.

System prompt
You are an experienced software engineer. When asked for code, output complete, runnable code with brief inline comments only where intent is non-obvious. Do not add long explanatory prose around the code — a one-line preamble is enough.
User prompts (10)

  code_001
Write a Python function that takes a directory path and returns the 10 largest files (by size) recursively, as a list of (path, size_bytes) tuples sorted descending. Handle permission errors gracefully.

  code_002
In TypeScript, implement a debounce<T extends (...args: any[]) => any>(fn: T, wait: number) function with a cancel() method on the returned function. Provide a small test case using setTimeout.

  code_003
Write a Python class RateLimiter implementing the token-bucket algorithm with thread-safe acquire(n=1) and try_acquire(n=1) methods. Use threading.Lock and time.monotonic. Include a small usage example.

  code_004
Write a SQL query for PostgreSQL that, given a table orders(id, customer_id, total_cents, created_at), returns each customer's total revenue and average order size for the last 90 days, ordered by revenue descending, top 100 only.

  code_005
In Go, implement a function MergeSortedChannels[T constraints.Ordered](chans ...<-chan T) <-chan T that merges any number of pre-sorted channels into a single sorted output channel. Close the output when all inputs are drained.

  code_006
Write a small React component <CopyButton text={...}/> using TypeScript and hooks that copies text to clipboard, shows 'Copied!' for 1.5 seconds, then resets. Use the Clipboard API and handle the promise rejection.

  code_007
Write a Python function that, given a string, returns True if the string is a valid IPv4 address, without using the ipaddress module or regex. Include 6 test cases covering edge cases.

  code_008
In Rust, implement a trait Cache<K: Eq + Hash, V: Clone> with get, put, and len methods, and an LruCache struct that implements it with a fixed capacity. Use HashMap and a doubly linked list (or VecDeque), no external crates.

  code_009
Write a Bash script that watches a directory for new files matching *.csv, and for each new file, prints its line count and first column header to stdout. Use inotifywait.

  code_010
Write a Python script using httpx and asyncio that fetches 100 URLs concurrently with a max of 10 in flight at once, and writes (url, status_code, elapsed_ms) to a CSV. Handle timeouts as status_code = -1.- Long-form response - documentation-style or explanatory answers
max_tokens 2200
Draft an email, memo, or short report. ~1000+ token output.

System prompt
You are a professional writer. Produce well-structured prose suitable for a corporate audience. Aim for roughly the length the user implies; do not pad with filler.
User prompts (10)

  long_001
Write a 350-word internal memo from the head of platform engineering announcing that, starting next quarter, all new internal services must use the standard observability bundle (OpenTelemetry traces, metrics, structured logs to Loki). Acknowledge the migration effort, explain the reasons, and outline the support that will be offered.

  long_002
Draft a 400-word email to a B2B customer explaining a 4-hour service degradation that occurred yesterday. Be transparent about the root cause (a misconfigured database failover), describe the customer impact, the immediate fix, and three concrete preventative actions. Offer a follow-up call.

  long_003
Write a 500-word architecture decision record (ADR) for adopting Postgres logical replication over a self-built CDC pipeline for shipping events to a downstream analytics warehouse. Cover context, decision, alternatives considered, and consequences.

  long_004
Write a 450-word LinkedIn post from a CTO sharing reflections after one year of running an internal AI assistant in production, what worked, what didn't, and three recommendations for peers starting now. The tone should be thoughtful and concrete, not promotional.

  long_005
Draft a 500-word section of a security policy document on the topic of secrets management. Cover acceptable storage (vaulted), prohibited practices, rotation cadence, and incident response when a leak is suspected. Use clear, enforceable language.

  long_006
Write a 500-word retrospective note summarizing a six-month migration from a monolithic Rails application to three smaller services. Cover business motivation, technical approach, two surprises, and what the team would do differently next time.

  long_007
Draft a 400-word product release note for the launch of a new SSO integration with Microsoft Entra ID, aimed at IT admins. Cover what's new, supported scenarios, configuration steps at a high level, and a link placeholder for the full guide.

  long_008
Write a 450-word memo from a team lead recommending the team move from two-week sprints to a continuous flow with weekly check-ins. Acknowledge concerns, present the rationale, and outline how planning, prioritisation, and visibility will work in the new model.

  long_009
Draft a 500-word board update covering the past quarter's progress on the company's cloud cost-reduction initiative. Mention specific levers (rightsizing, savings plans, decommissioning, storage tiering), quantify savings against the target, and flag the two largest remaining risks.

 long_010
Write a 400-word internal blog post celebrating the team that delivered an on-call response platform on time, without using hype language. Focus on the engineering challenges they overcame and the impact on incident response time.- Summarization - compression of longer text
max_tokens 1500
Summarize a passage in 4–6 sentences. ~300–500 token output.

System prompt
You are an expert technical editor. Summarize the user's text in 4 to 6 sentences. Preserve all numbers, names, and dates exactly. Do not add information that is not in the source.
User prompts (10)

sum_001
Summarize the following:
In the third quarter of 2025, Neo expanded its NeoCloud platform with two new availability zones in Stavanger and Bergen, bringing the total number of zones in Norway to seven. The expansion adds 38 megawatts of usable capacity and is part of a broader 1.4 billion NOK investment program announced in February 2024. According to CTO Kari Nilsen, the new zones use direct-to-chip liquid cooling, which Neo claims reduces cooling-related power use by approximately 41 percent compared to traditional air cooling. The first customer workloads, primarily belonging to public-sector tenants subject to data residency rules, were migrated in late September. A second phase is scheduled for the second quarter of 2026.

sum_002
Summarize the following:
The European Union's AI Act entered into force on 1 August 2024, with the bulk of obligations applying from 2 August 2026. The act establishes a tiered system: 'unacceptable risk' practices such as social scoring are banned outright, 'high risk' systems used in areas like recruitment, credit scoring, and critical infrastructure must meet conformity-assessment, transparency, and human-oversight requirements, and 'general-purpose AI' models above a 10^25 FLOPs training threshold face additional systemic-risk obligations. Member states are required to designate national supervisory authorities by August 2025. Fines can reach 7 percent of global annual turnover for the most serious infringements.

sum_003
Summarize the following:
Apache Kafka 3.7, released in February 2024, made KRaft mode generally available for production, removing the long-standing dependency on Apache ZooKeeper for cluster metadata. KRaft uses a built-in Raft-based quorum of controller nodes, simplifying operations and reducing the failure surface. The release also introduced tiered storage as a preview feature, allowing older log segments to be offloaded to object storage such as S3 while remaining queryable through the standard consumer protocol. Benchmarks published by Confluent showed end-to-end p99 latency improvements of 5–15 percent for low-throughput topics, and substantial cost reductions for clusters retaining more than seven days of data.

sum_004
Summarize the following:
The James Webb Space Telescope, launched on 25 December 2021 and operational at the Sun-Earth L2 Lagrange point since mid-2022, has now produced more than 4,500 peer-reviewed publications. Its near-infrared instruments have detected galaxies at redshifts greater than 14, corresponding to less than 300 million years after the Big Bang, considerably earlier and more massive than most pre-launch models predicted. Webb has also resolved water vapour and carbon dioxide signatures in the atmospheres of several sub-Neptune exoplanets, and produced the first direct image of an exoplanet around a Sun-like star using the coronagraph mode. Operations are currently funded through 2027, with two further extensions under discussion.

sum_005
Summarize the following:
The 2023 Nobel Prize in Physiology or Medicine was awarded jointly to Katalin Karikó and Drew Weissman for their discoveries concerning nucleoside base modifications that enabled the development of effective mRNA vaccines against COVID-19. Their key finding, reported in 2005, was that replacing uridine with pseudouridine in synthetic mRNA dramatically reduces innate immune activation while preserving translation efficiency. This insight, ignored or rejected by major journals at the time, became the foundation for both the Pfizer-BioNTech and Moderna vaccines administered to billions of people during the pandemic. The Karolinska committee cited the laureates' work as 'fundamentally changing our understanding of how mRNA interacts with the immune system'.

sum_006
Summarize the following:
Norges Bank held the policy rate at 4.50 percent at its November 2024 meeting, the seventh consecutive meeting without a change. In the accompanying monetary-policy report, the bank's executive board signalled that the rate would most likely be cut once during the first quarter of 2025, somewhat earlier than the September forecast had implied. Underlying inflation, measured as the CPI-ATE, fell to 2.7 percent in October, within reach of the 2 percent target, while wage growth remained close to 5 percent. Governor Ida Wolden Bache emphasised that future decisions would be data-dependent and that a premature cut could anchor inflation expectations above target.

sum_007
Summarize the following:
Kubernetes 1.30, codenamed 'Uwubernetes', was released on 17 April 2024 with 45 enhancements, of which 17 graduated to stable. Notable promotions include the structured-authentication-configuration feature, which allows multiple OIDC providers to be configured declaratively, and the AppArmor profile field on the container security context, which replaces the previous annotation-based mechanism. In-place vertical pod autoscaling moved to beta, enabling resource-request changes without pod restarts. The release also includes a number of long-running deprecations: the in-tree gce-pd, vsphere, and azure-disk volume plugins are now scheduled for removal in 1.31, and users are urged to migrate to the corresponding CSI drivers.

sum_008
Summarize the following:
In April 2024, the Norwegian Data Protection Authority concluded a two-year investigation into a major retail loyalty programme, finding that the company had collected purchase histories beyond what members had been informed about and used them to train internal segmentation models without a separate legal basis. The authority issued an administrative fine of 65 million NOK, the second-largest under GDPR in Norway to date, and ordered the deletion of all derived training data within six months. The retailer announced that it would not appeal and committed to publishing a privacy-impact assessment for any future model training using customer data.

sum_009
Summarize the following:
The Long Term Support release of PostgreSQL 17 became generally available on 26 September 2024, introducing a new memory-management subsystem for vacuum that the project says reduces memory use during table cleanup by up to 20-fold on workloads with many dead tuples. Logical replication received support for failover slots, allowing subscribers to continue from a standby after a primary failure without manual intervention. SQL/JSON path expressions were extended with a JSON_TABLE function, simplifying conversion of JSON documents into relational rows. Performance benchmarks from EnterpriseDB show 10–40 percent improvements on common OLTP workloads compared with version 16.

sum_010
Summarize the following:
The International Energy Agency's World Energy Outlook 2024, released in October, projects that under current policies global oil demand will plateau before 2030 at around 102 million barrels per day, roughly 2 percent above the 2023 level. Coal demand is expected to peak in 2025 and then decline by approximately 1 percent per year, while solar PV deployment is forecast to triple between 2023 and 2030, reaching 5,500 gigawatts of installed capacity. Investment in clean energy is now running at 1.8 trillion USD per year, almost double the level invested in fossil fuels, but the agency warns that this is still about 40 percent below what is required to align with the 1.5 degree target.- Multi-turn conversation - several turns where context grows over time
max_tokens 1200
5–7 turn conversations that grow context. Each turn is timed independently so we can see how speed degrades as context grows.

System prompt
You are a helpful assistant. Keep your answers focused on what was just asked, not the full conversation history.
Conversations (3)

mt_001
Pair-programming a small Python utility
6 turns
  Turn 1
I want to write a small Python utility that scans a folder of markdown files and produces a JSON index of (filename, title, h1 heading, word count). What approach would you suggest?
  Turn 2
Good. Show me the function signature and the data class for one entry, but don't write the implementation yet.
  Turn 3
Now implement parse_file(path) that returns one entry. Use only the standard library.
  Turn 4
Add a function build_index(folder) that walks the folder and returns a list of entries, sorted by filename.
  Turn 5
Now add a small CLI using argparse: 'index.py <folder> --out index.json'.
  Turn 6
Finally, add a simple unit test for parse_file using a temporary directory.

mt_002
Working through an SRE incident
6 turns
  Turn 1
Our checkout service is throwing 5xx at about 2 percent of requests since 09:14. CPU is normal, memory is normal, downstream dependencies look fine. Where would you start?
  Turn 2
Logs show a spike in 'context deadline exceeded' from a Redis call. The Redis instance metrics look healthy though. What does that suggest?
  Turn 3
TCP retransmits on the application host are at 4 percent — pre-incident they were 0.1 percent. Does that change your hypothesis?
  Turn 4
We just deployed a network policy change at 09:10. What would you look at to confirm or refute it as the cause?
  Turn 5
We rolled back the network policy and 5xx returned to normal within two minutes. What should the post-incident actions be?
  Turn 6
Write a one-paragraph customer-facing summary of the incident, no jargon.

mt_003
Designing a small data model
6 turns
  Turn 1
I need to model 'feature flags' for a multi-tenant SaaS product. Each flag belongs to a tenant, can be on/off globally for that tenant, and can also be overridden per user. What are the obvious entities?
  Turn 2
Add the SQL DDL for those tables in PostgreSQL, with appropriate primary keys, foreign keys, and indexes.
  Turn 3
How would you write a query to evaluate the effective state of flag F for user U in tenant T, in a single round-trip?
  Turn 4
What if we want a third level — overrides per group of users, where a user can be in multiple groups? Update the schema and the query.
  Turn 5
How would you handle cache invalidation when a flag value changes? Outline a simple approach using Redis pub/sub.
  Turn 6
Last thing — how would you instrument this so we can see, in production, which flag evaluations are happening most often?Again, we are not scoring the quality of the answers here. The prompts are there to produce realistic request shapes: short, long, interactive, batch-oriented and context-heavy.
Running it
The benchmark has three presets, from a quick run to a fuller test with more repetitions and higher concurrency.
A single request shows how a model behaves on its own, but production traffic is rarely that tidy. Users arrive at the same time, pipelines create bursts, operational events create bursts, and agents can generate several calls as part of one task. That's why we test with multiple requests in flight. If a model is fast with one request but slows down sharply at higher concurrency, that's still useful to know. It tells us how to route traffic, where we may need more capacity, and which workloads the model is ready for.
A note on measuring latency
Latency benchmarks are rarely completely neutral.
Our benchmark runner is in Oslo and the GLM-5.1 endpoint runs on Intility-operated data centers in the same region. For this benchmark, GPT-5.5 runs in the EU data zone, where the processing region might vary based on load at any given time. That geography matters.
The measurements include model serving time, network path, provider-side queueing and infrastructure behavior, but the user doesn't experience those as separate things, they experience the total wait. That's why we measure from where the request actually originates.
This gives GLM-5.1 a locality advantage in our setup and it would be dishonest not to say that. But it's also not an artificial advantage. For many enterprise workloads, the request does not originate in the same region as the public cloud / model provider LLM endpoint. A system may run in Norway, Denmark, Germany or on private infrastructure, while the model endpoint sits in another country or region. That distance becomes part of the production experience.
A note on verbosity and token caps
Token caps sit right on top of the cost number. Every category sends a fixed max_tokens ceiling, mostly so a runaway generation cannot wreck the latency measurements. But a cap also bounds cost silently: if a model would have written more, the cap truncates it and the per-request cost looks lower than it really is. So if one model hits the ceiling more often than the other, the cheaper-looking model on paper might just be the one getting cut off. With reasoning off this is easier to judge, because output tokens are the whole answer.
Underneath the cap is the more interesting axis: verbosity.
Output tokens are the expensive side of the bill ($30 per million out for GPT-5.5 against $5 in), and those same tokens have to stream at the model's tokens-per-second rate. A chattier model is both pricier and slower for the identical task. By reputation the two models pull in opposite directions: GPT-5.5 is unusually token-effective and even ships an explicit verbosity control, while the GLM family runs chattier and is steered through prompting.
Our run complicates that neatly. Those reputations come from runs with reasoning on and no length instruction. We do the opposite: reasoning off, and every system prompt pins the shape ("one or two short sentences", "4 to 6 sentences" etc.). Under those constraints what matters is instruction-following, not default chattiness. So the question for trusting the cost numbers is just: how often did each model overrun the cap? Only about 6% of requests did, and all of them were GPT-5.5, that is, the more concise model was the one that occasionally needed more room, on code and long-form prompts. GLM-5.1 held the line.
The lesson goes beyond this benchmark. In free-form chat, code explanations, or agent loops with many calls, output length matters. If one model uses more tokens to say the same thing, it can be both more expensive and slower on every request.
Verbosity is something to set on purpose, not discover later on an invoice.
Cross-category results
This first result sections show aggregate numbers across all prompt categories. The “Full results per category” section later breaks the same measurements down by dataset and workload type.
Time to first token
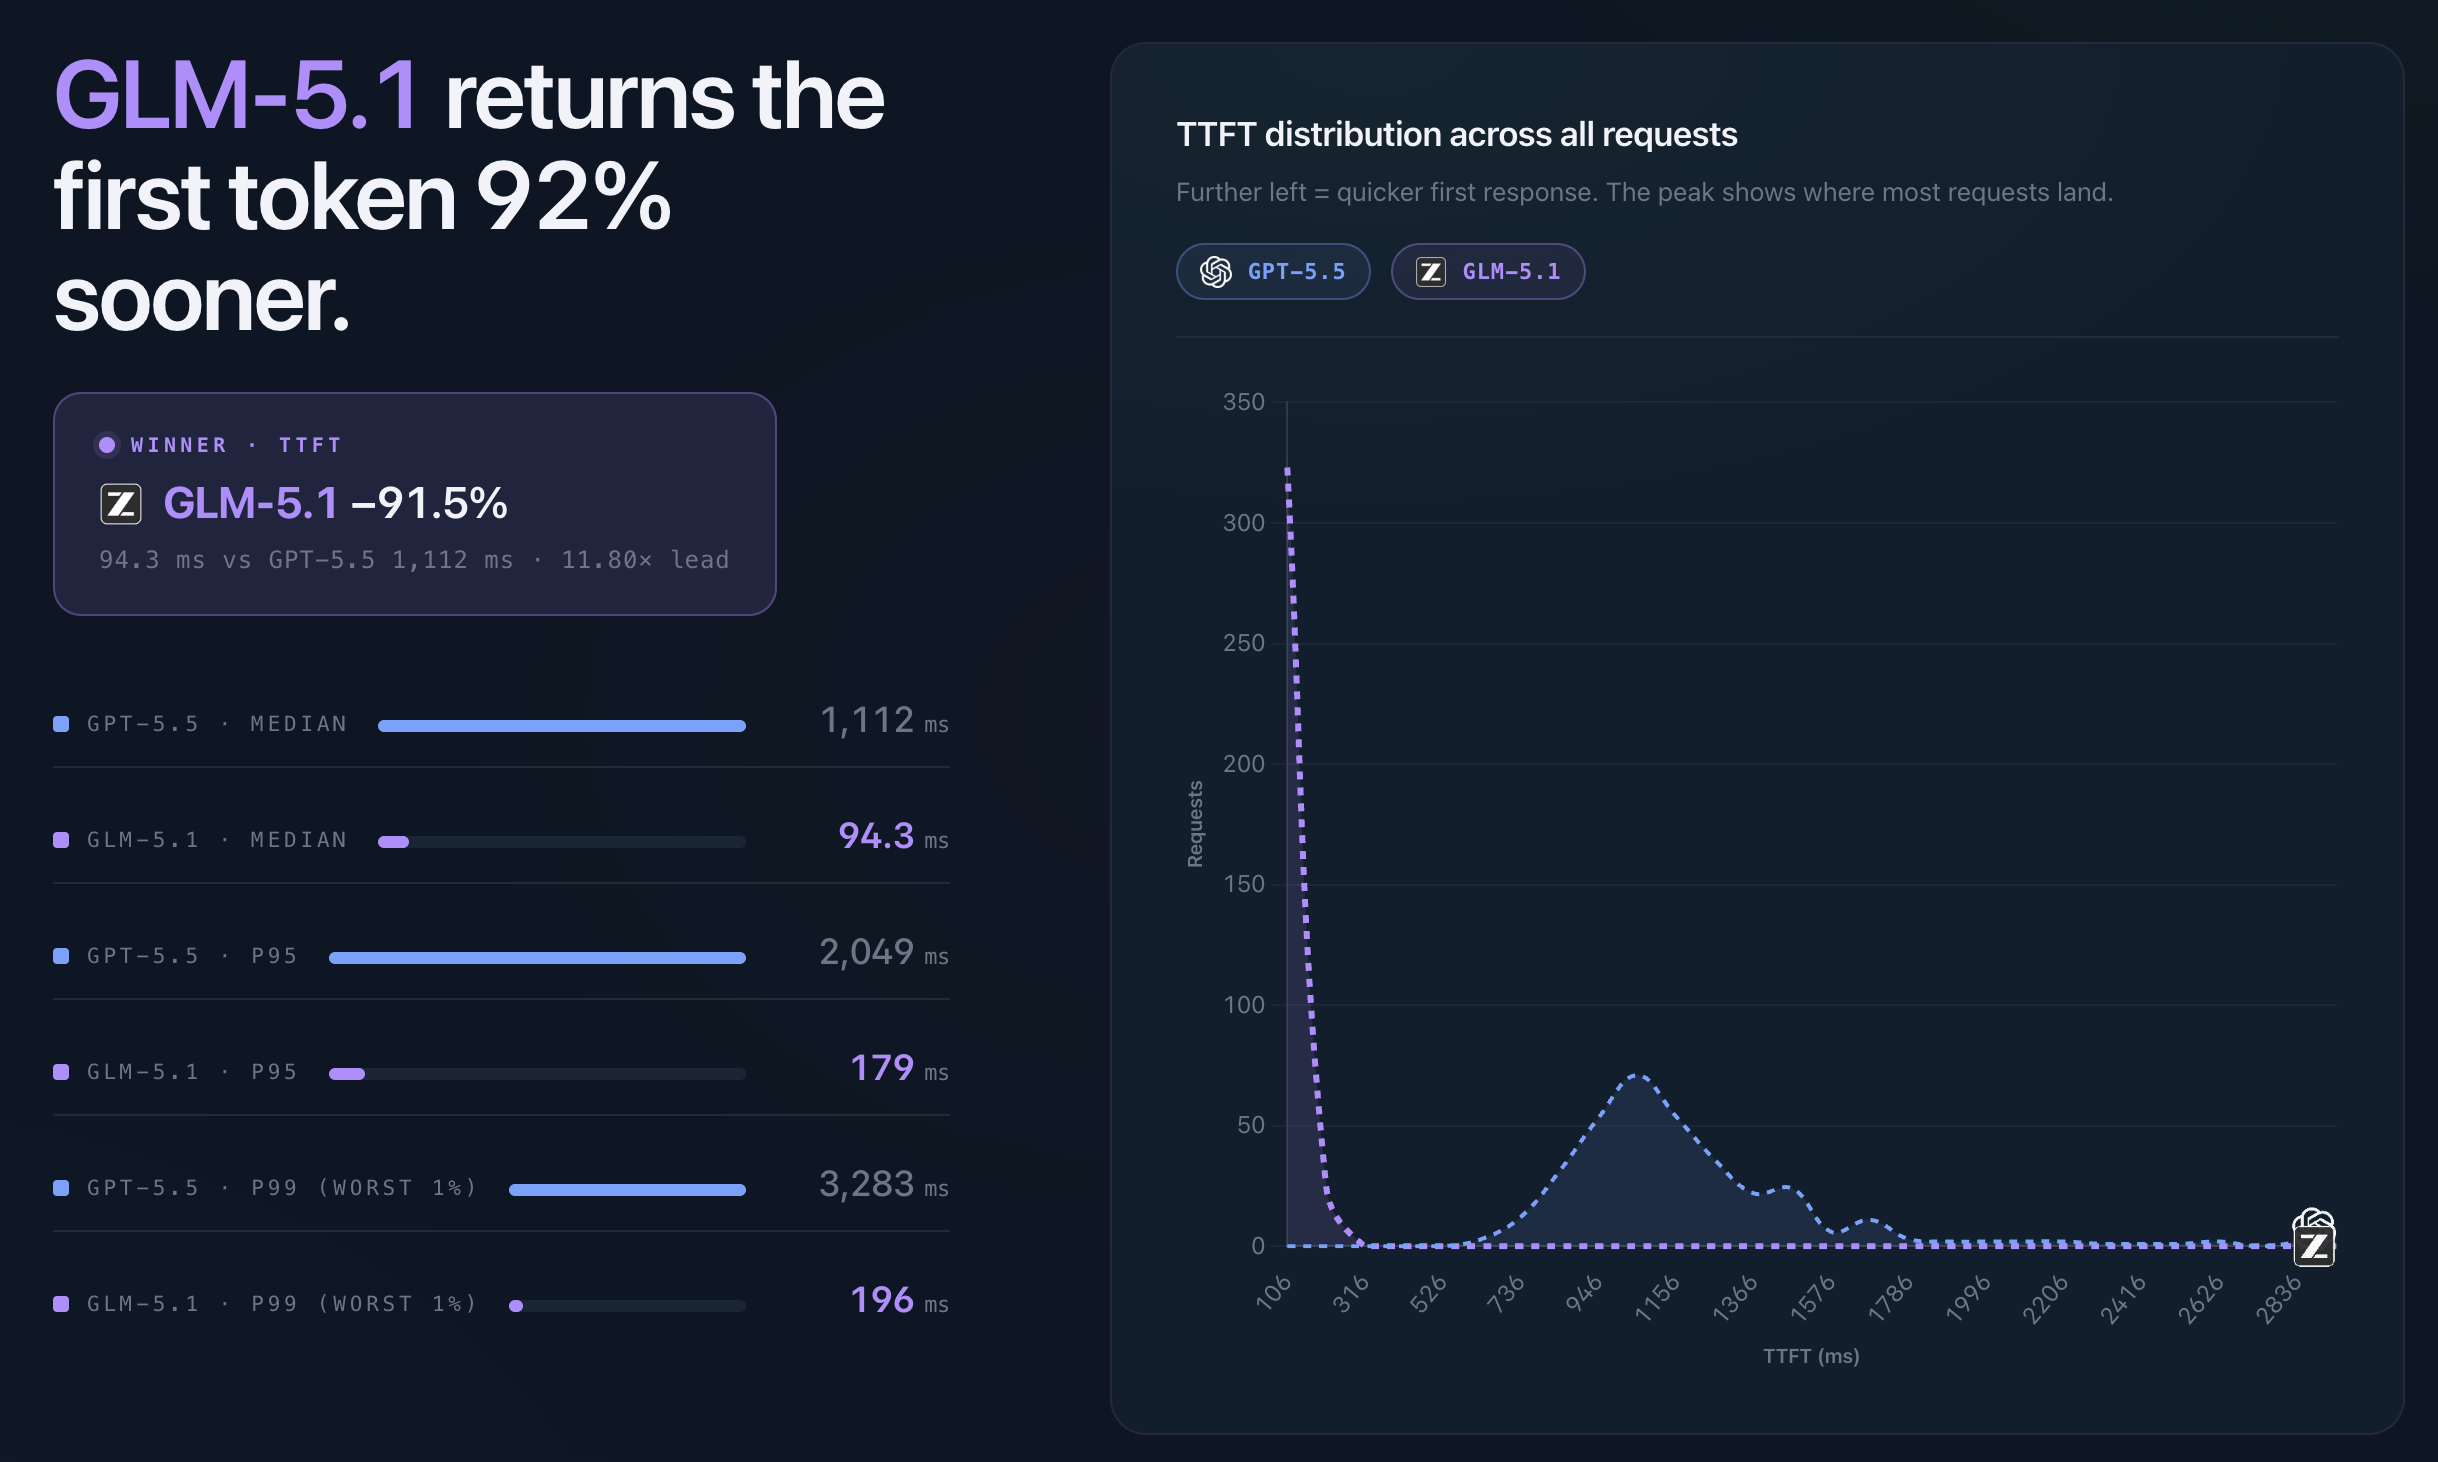
This is where GLM-5.1 has the clearest lead.
Median time to first token was 94 ms for GLM-5.1, compared with 1,112 ms for GPT-5.5. That is an 11.8× difference, or about 92% lower first-token latency.
This is especially relevant for workflows that need quick feedback (think user-facing tools or operational alert handling). Under a tenth of a second feels immediate. Waiting a little over a second before the first output arrives can still be workable, but it changes how naturally the model fits into the flow.
The tail follows the same pattern. GLM-5.1 stayed below 200 ms even at p99, while GPT-5.5 reached 3,283 ms.
Streaming speed / tokens per second

Once the first token has arrived, the picture is closer.
GPT-5.5 had the higher median throughput at 109 tokens per second, compared with 103 tokens per second for GLM-5.1. That is a modest lead of about 6%.
In practice, this means GPT-5.5 streams slightly faster once it gets going. For short answers, the difference matters less because first-token latency dominates the experience. For longer outputs such as code generation, summaries, documentation and multi-paragraph answers, throughput becomes more visible.
The result is a useful reminder that “fast” is not one metric. GLM-5.1 starts much faster. GPT-5.5 streams slightly faster after the response has started.
End-to-end latency
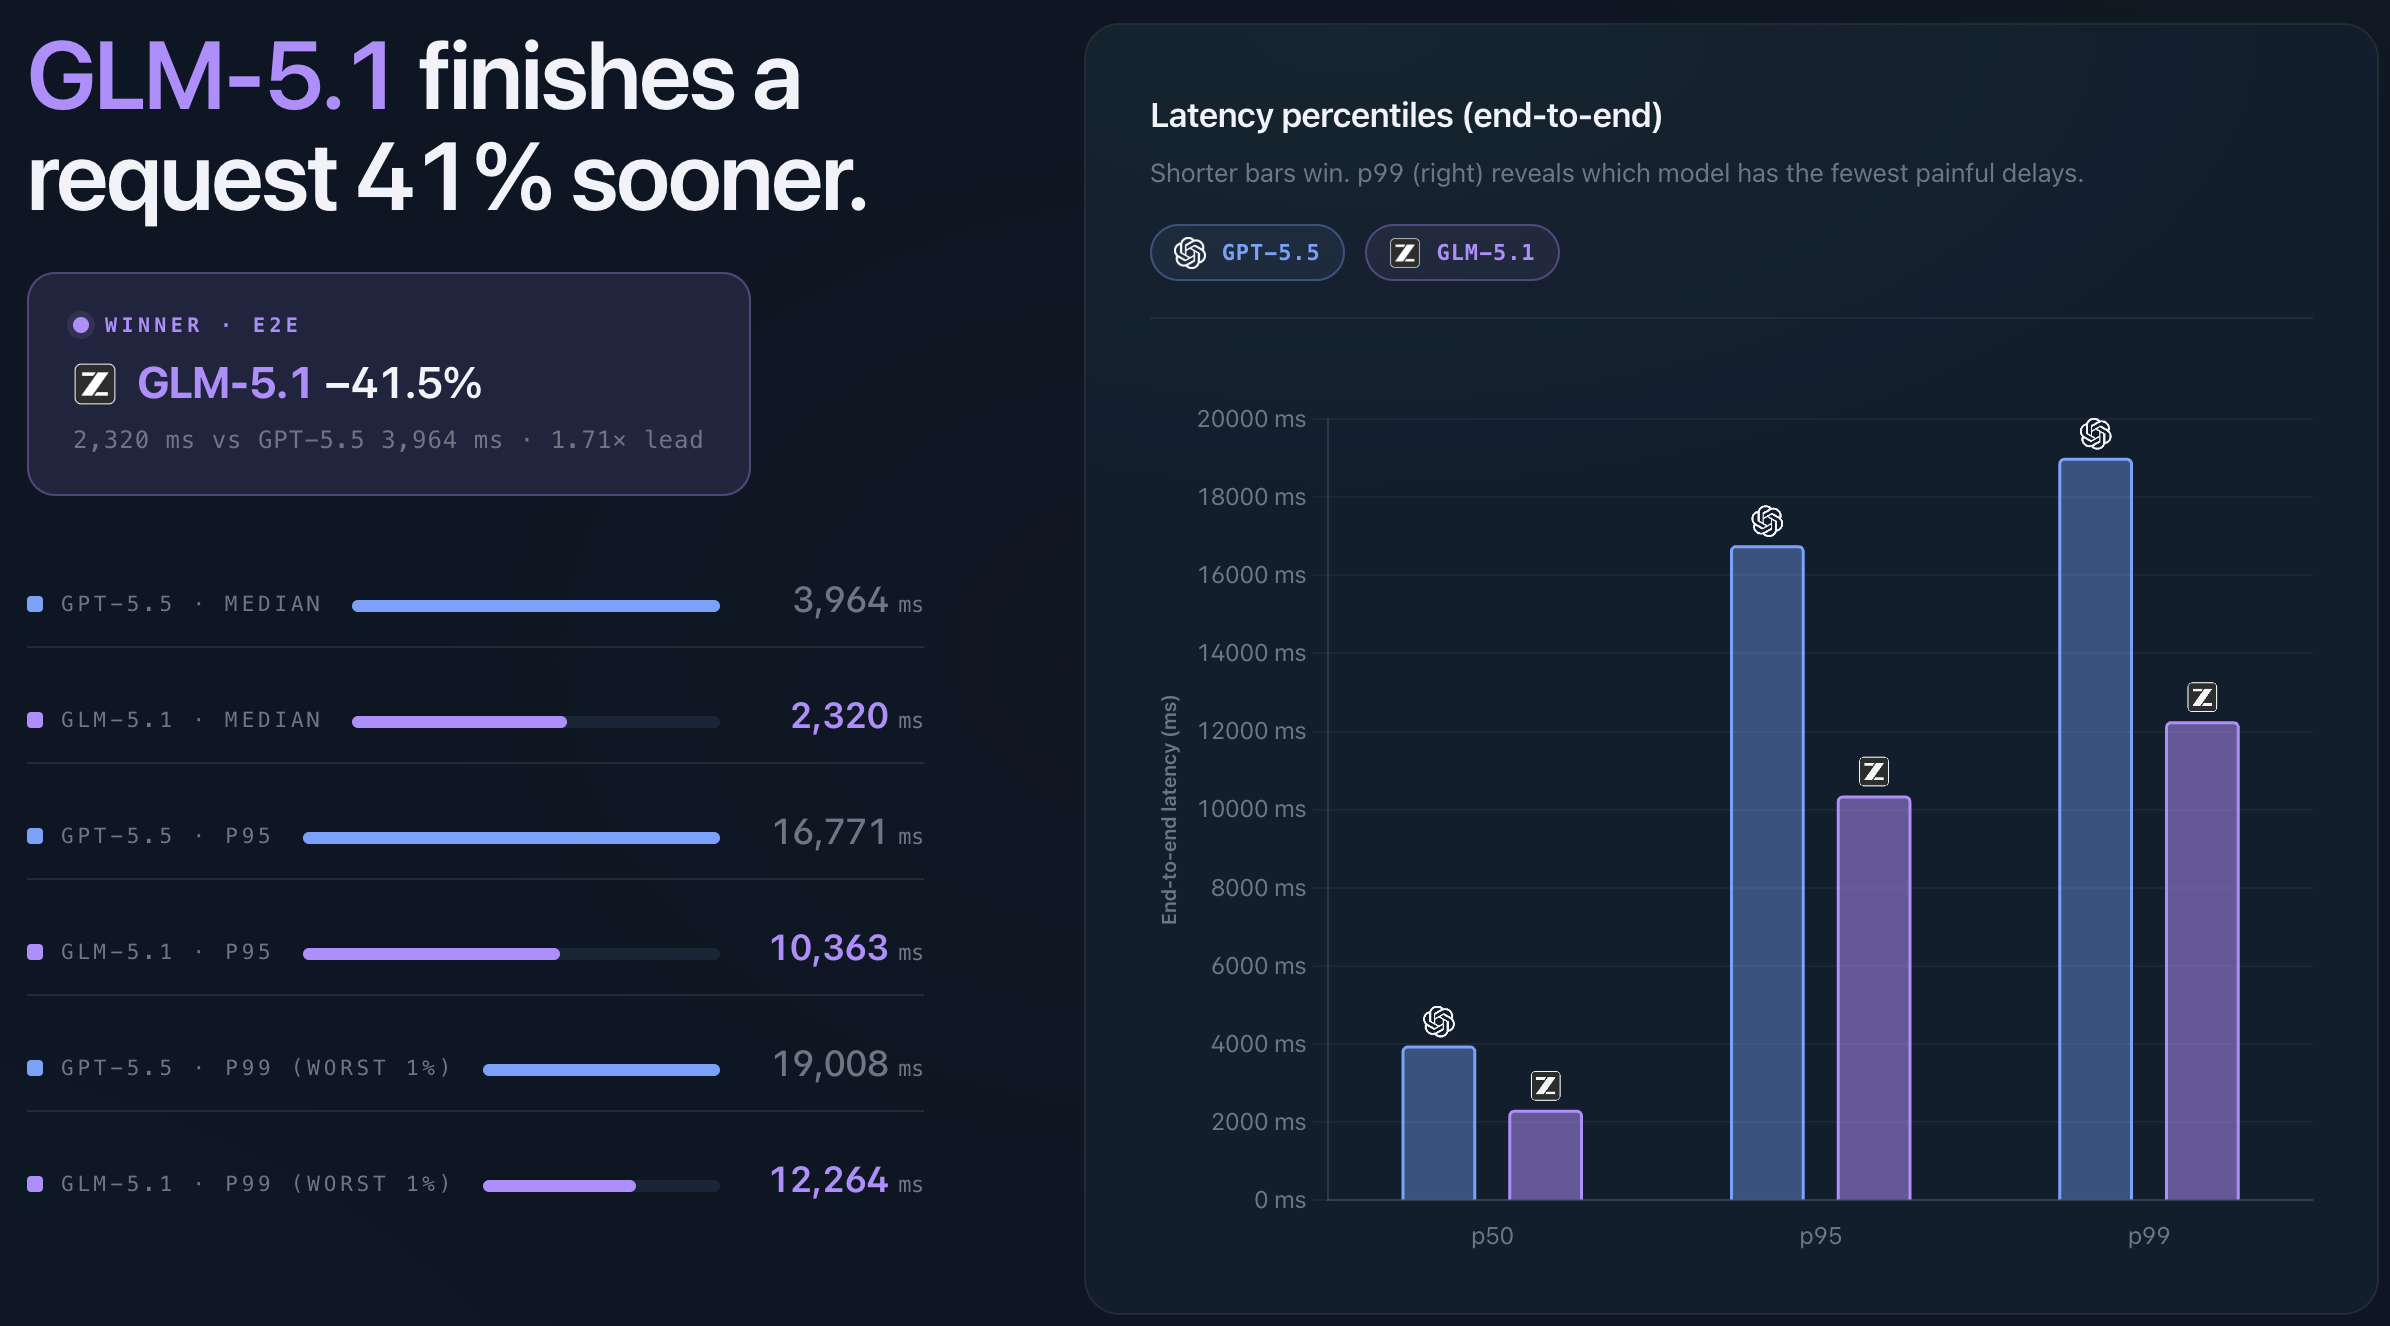
End-to-end latency combines both parts of the experience: waiting for the first token and waiting for the full response.
Here GLM-5.1 finished requests faster overall. Median end-to-end latency was 2,320 ms, compared with 3,964 ms for GPT-5.5 - about 41% lower.
The higher percentiles show the same pattern. At p95, GLM-5.1 was 10,363 ms versus 16,771 ms for GPT-5.5. At p99, GLM-5.1 was 12,264 ms versus 19,008 ms.
Concurrency
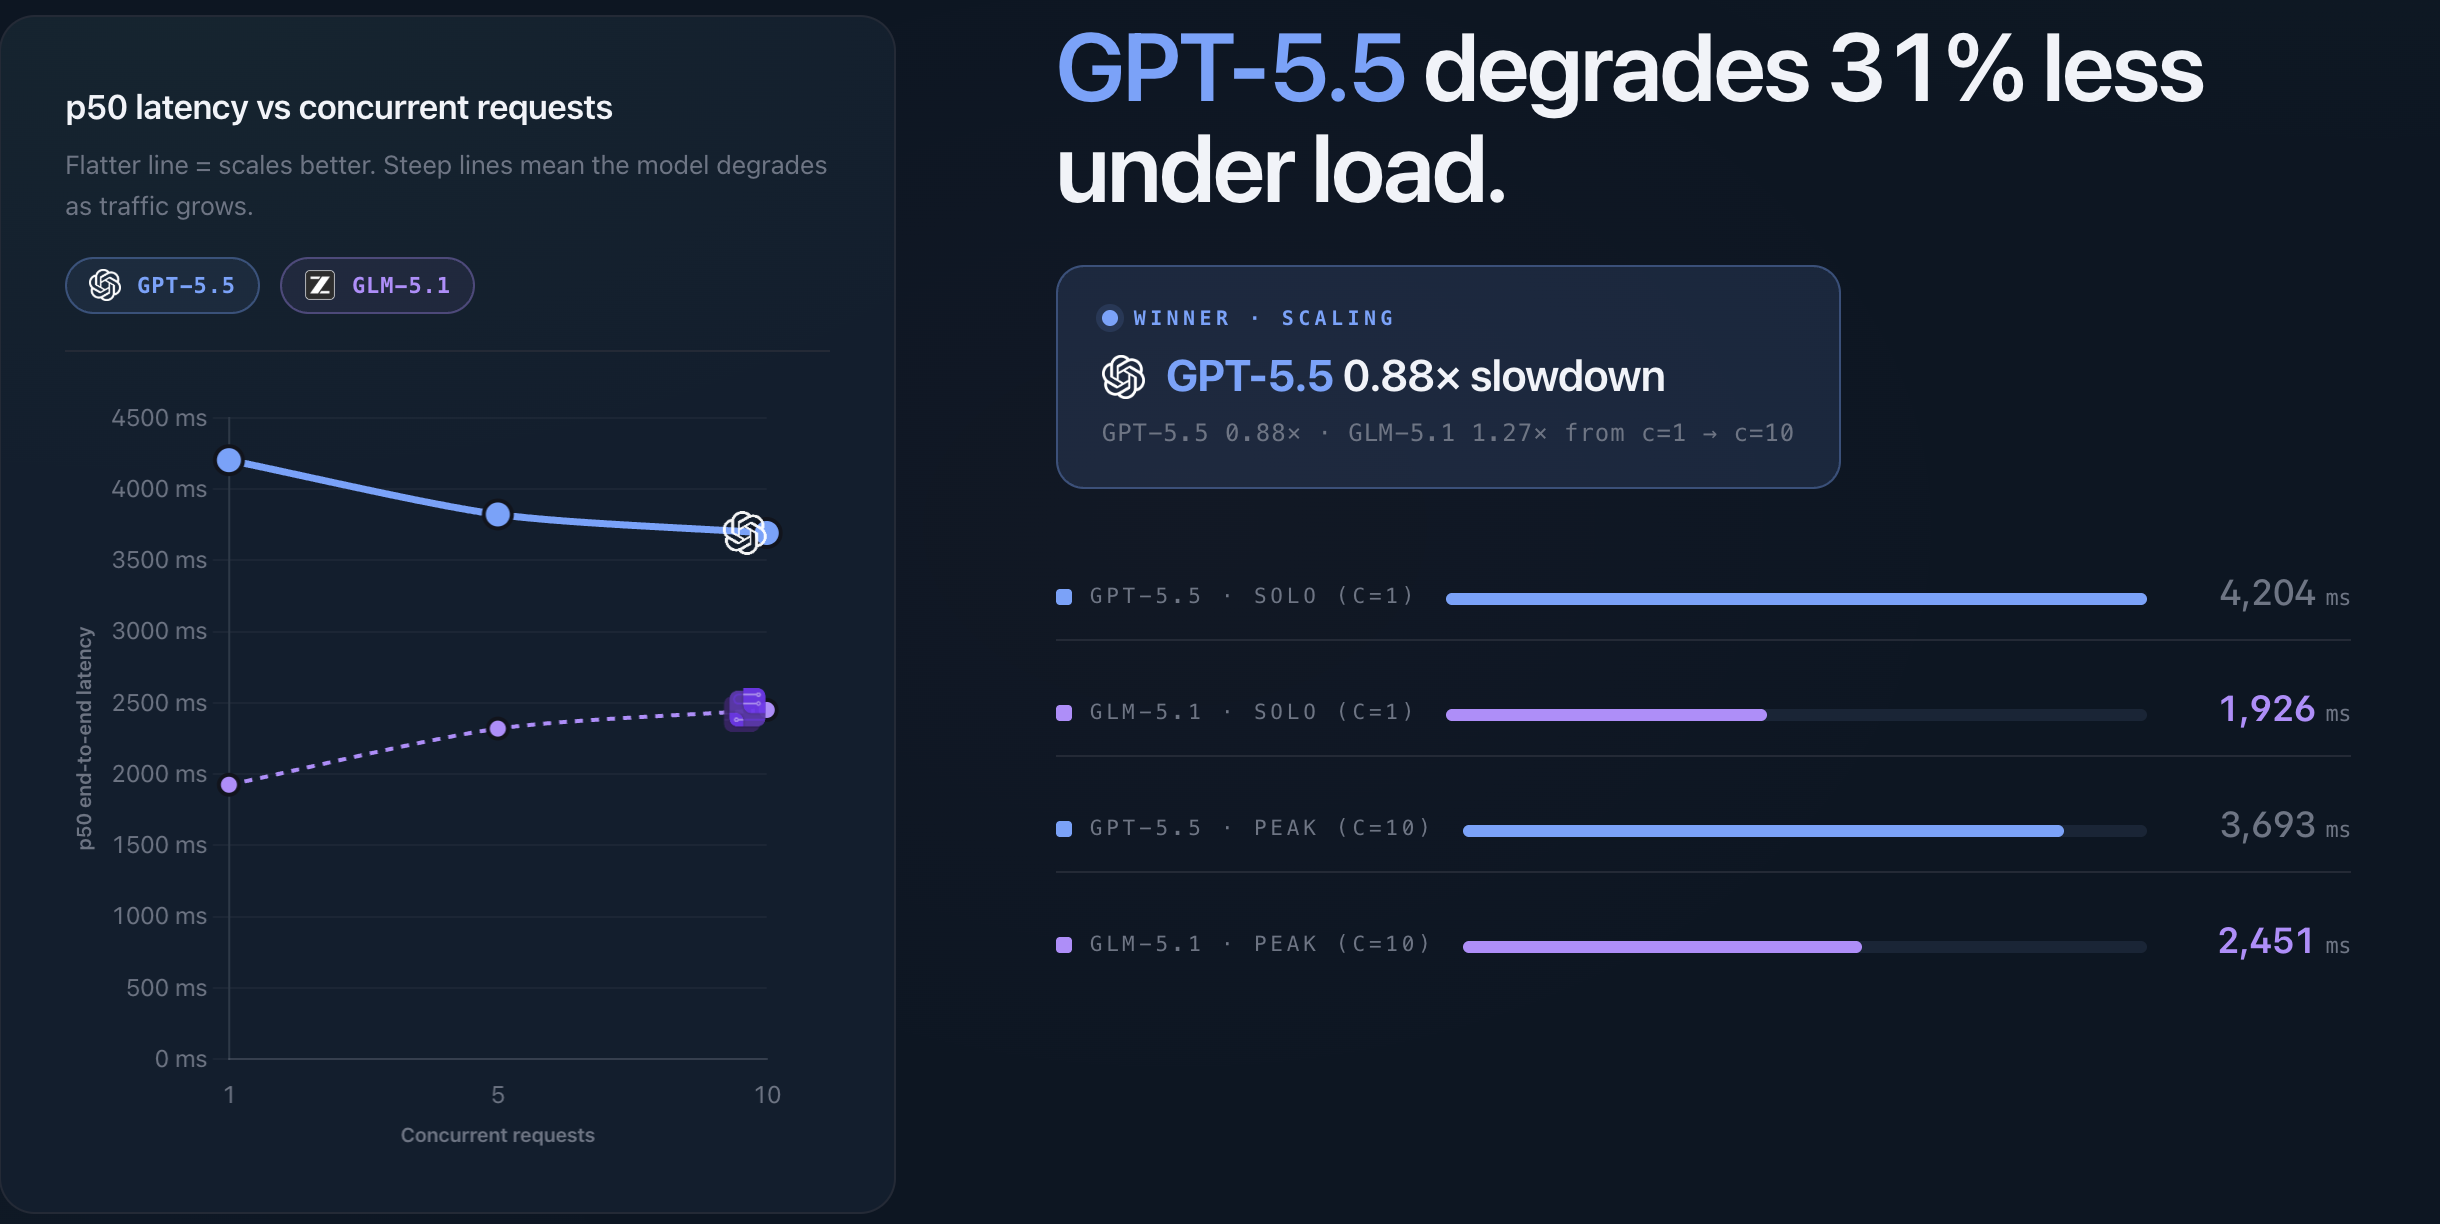
Concurrency is where the result gets more nuanced.
In this run, GPT-5.5 did not show a traditional slowdown as concurrency increased. Median latency was 4,204 ms at concurrency 1 and 3,693 ms at concurrency 10. That doesn't mean higher concurrency makes the model faster. It's more likely a sign of variation in the hosted serving layer, such as routing, queueing, regional capacity, or warm infrastructure paths in Azure AI Foundry.
GLM-5.1 followed a more expected pattern, increasing from 1,926 ms at concurrency 1 to 2,451 ms at concurrency 10.
The useful takeaway is that concurrency is not only about the model. It also reflects the serving layer around it; batching, queueing, capacity, routing, and rate limits. Those are the parts we need to understand when moving from single requests to production traffic.
Cost
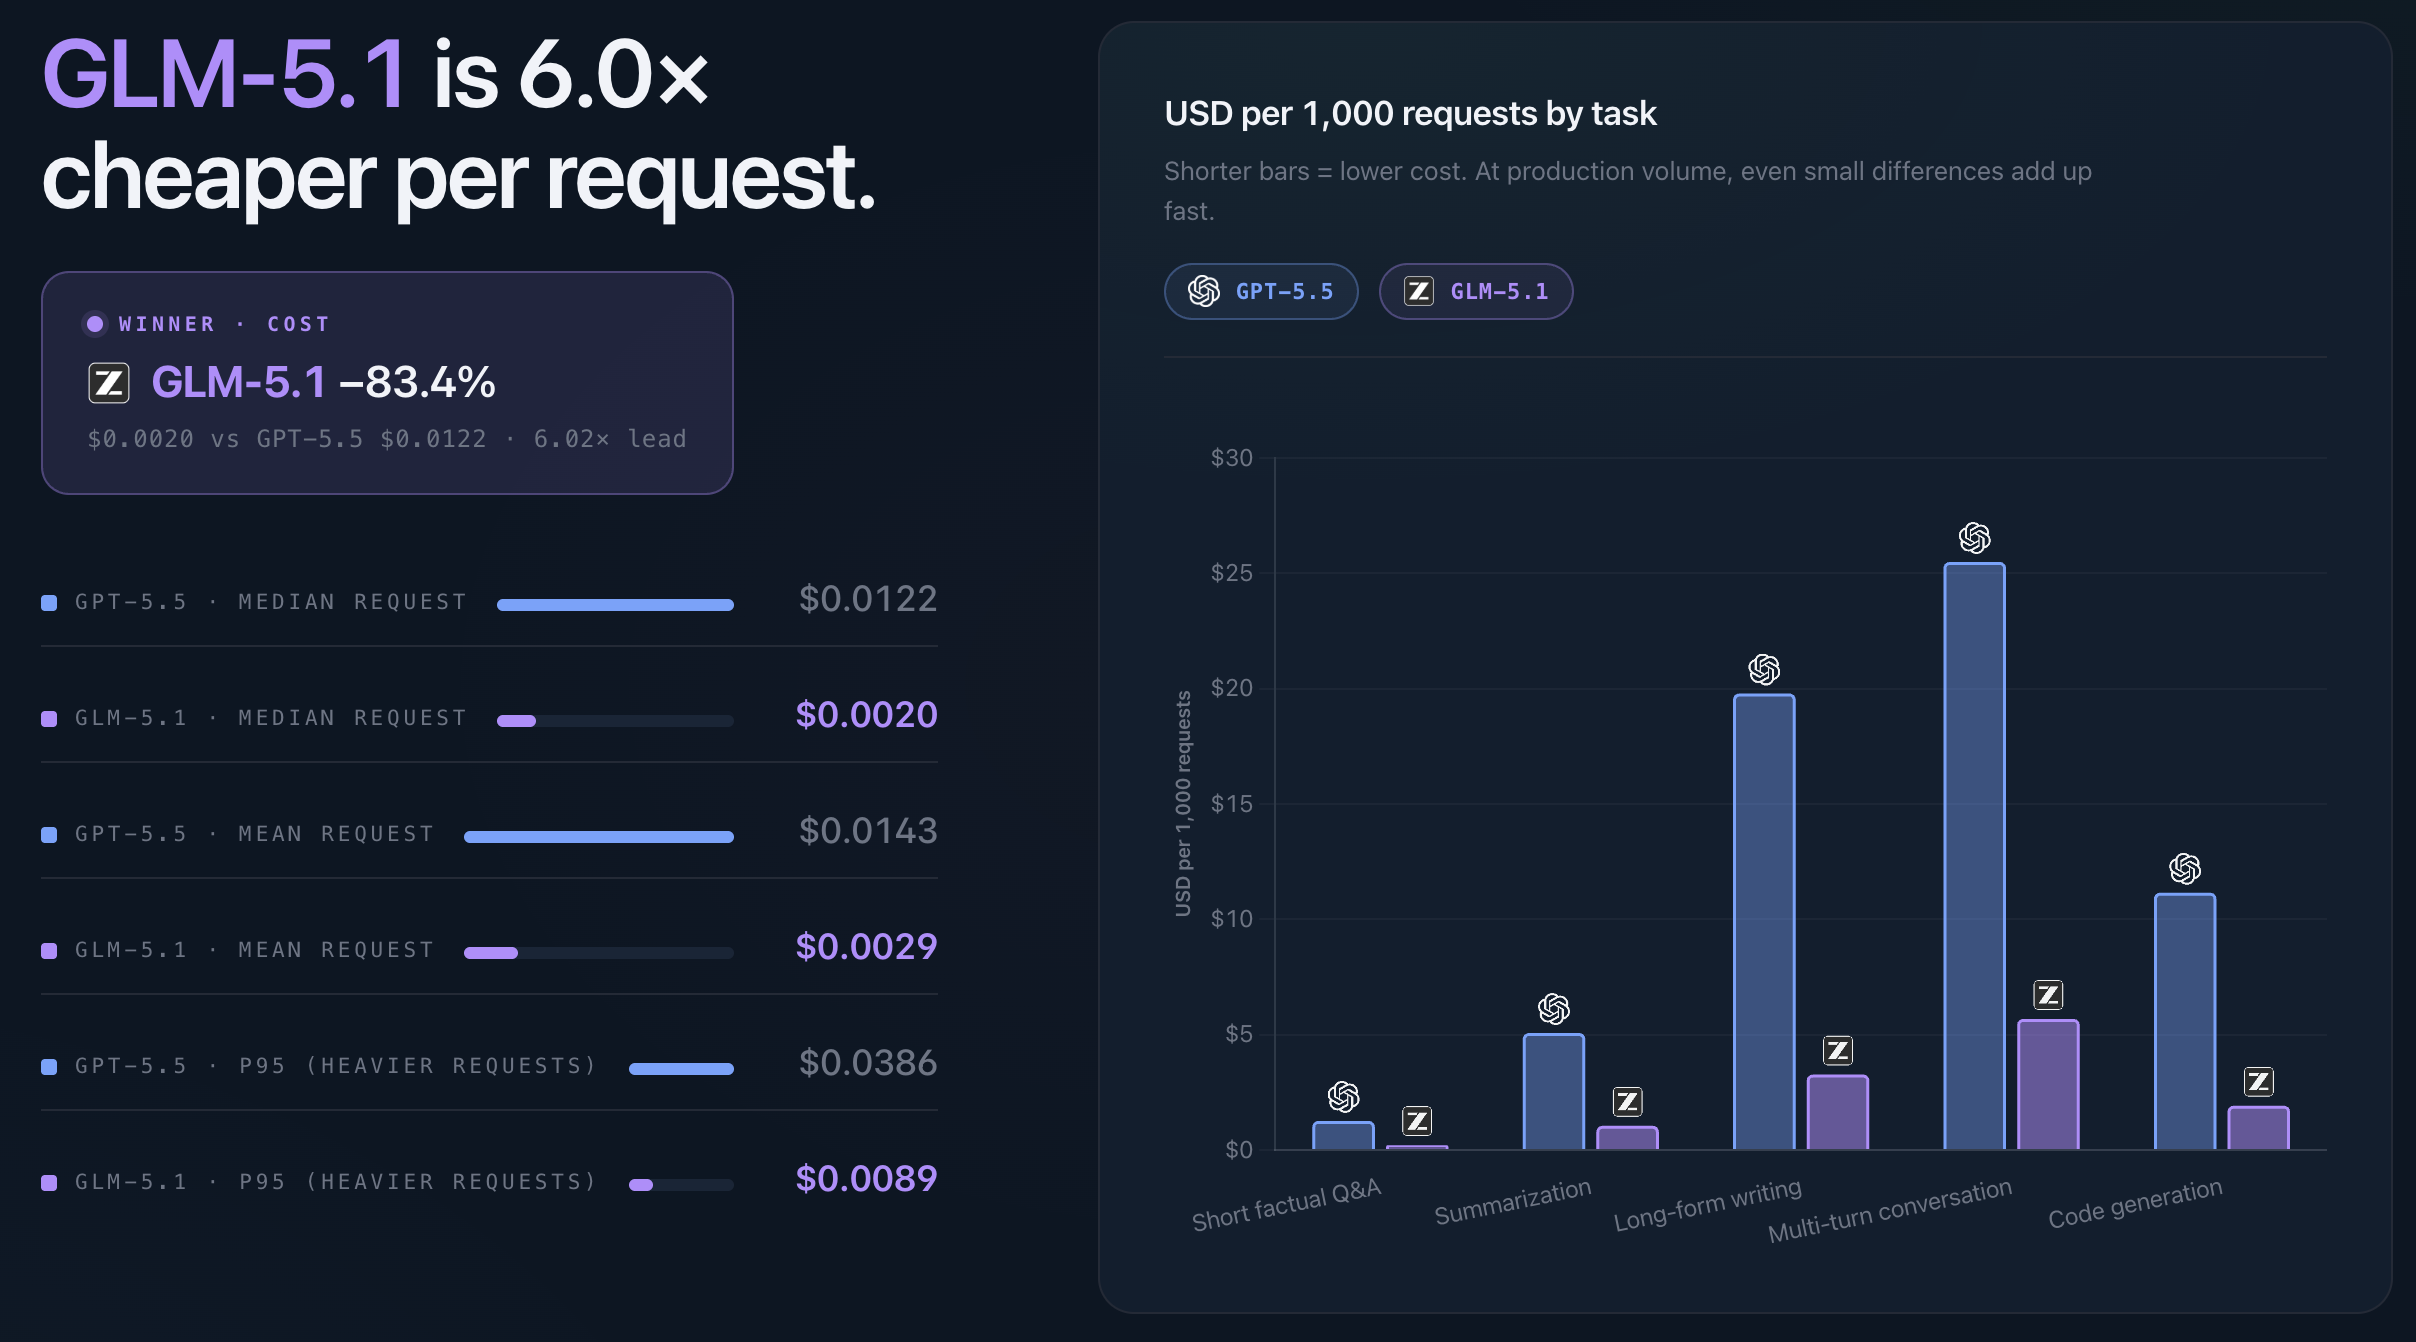
Cost is where GLM-5.1 has the other clear lead, and that is mostly expected from the token pricing.
The median request cost was $0.0020 for GLM−5.1 and $0.0122 for GPT-5.5. That makes GLM-5.1 about 6× cheaper per request in this benchmark.
This is where model choice quickly becomes more than an engineering preference. At low volume, the difference may not matter much, but at production volume it becomes visible. Lower request cost means more room to use the model where it's useful, without every new workflow immediately becoming a budget discussion.
Nobody wants every good idea to begin with a spreadsheet
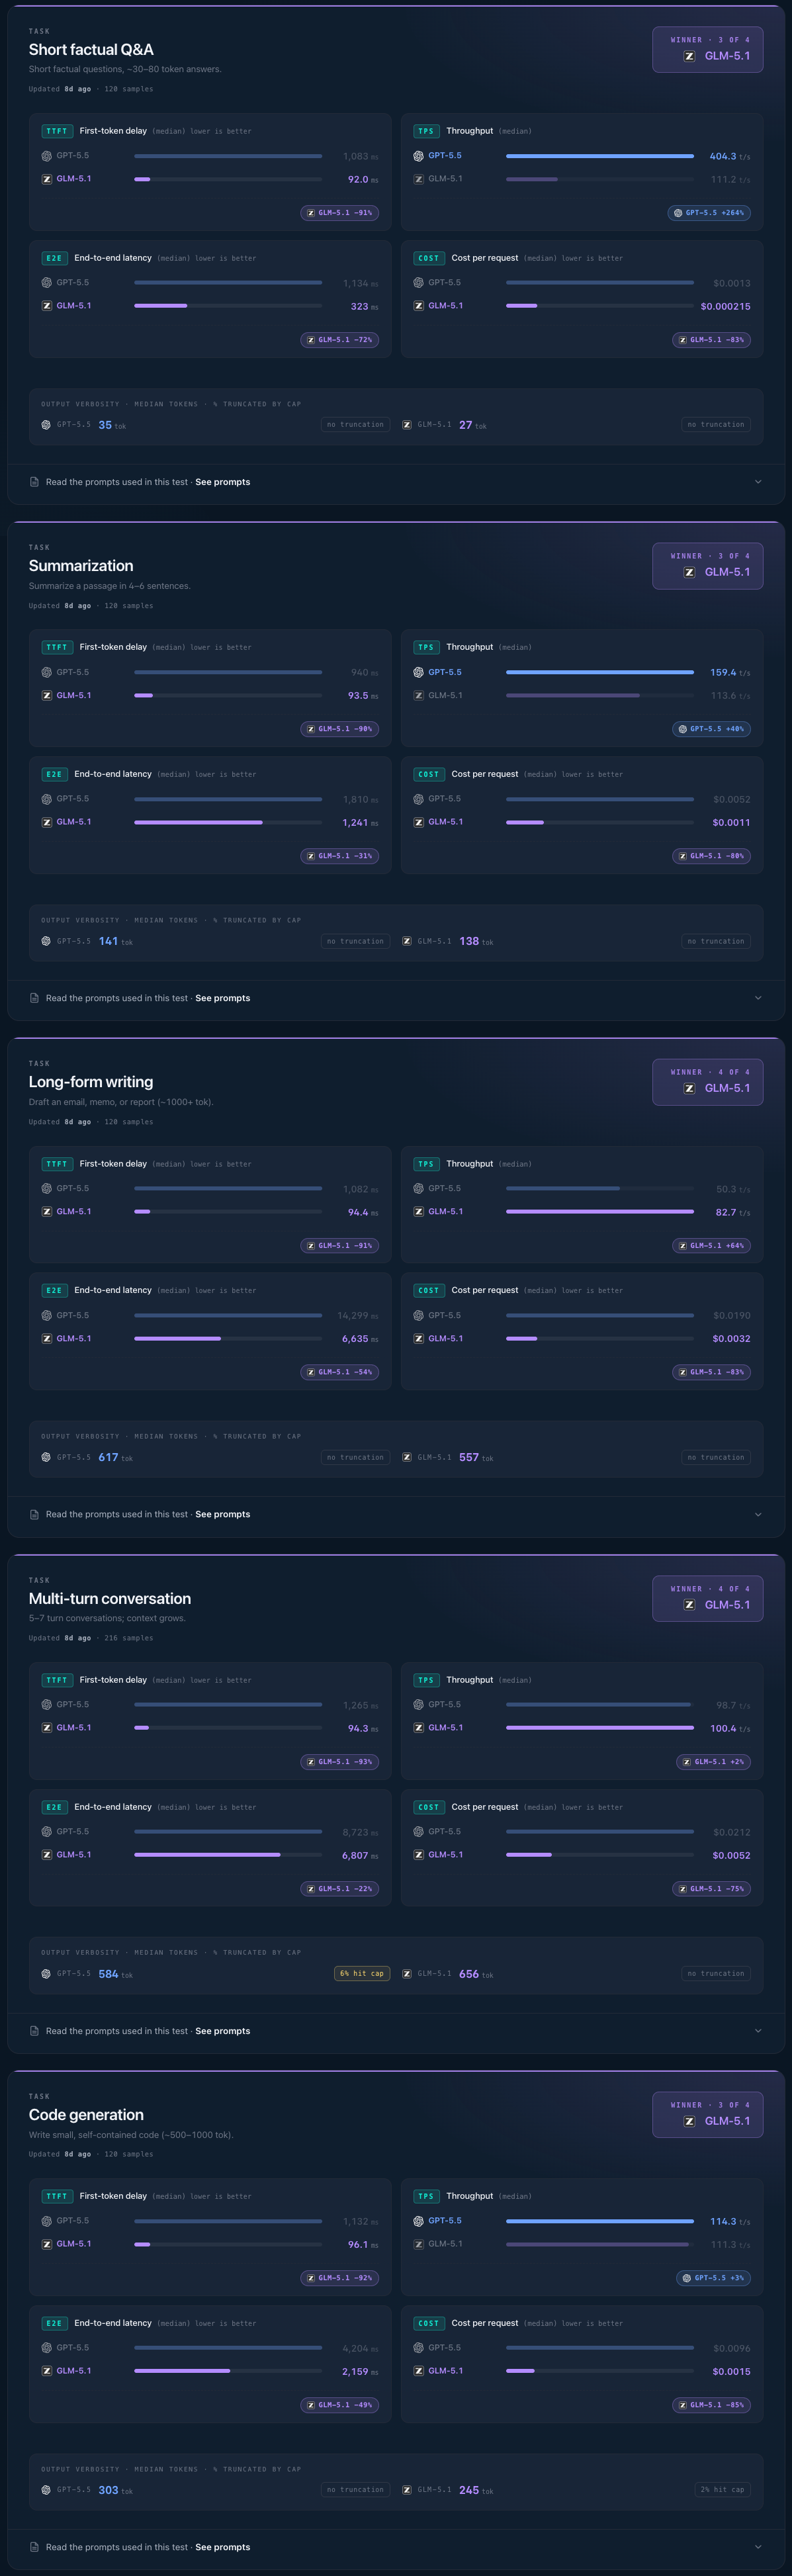
Full results per category
The sections above aggregate results across all prompt categories. The tables below show the same benchmark broken down by workload type and dataset, so the cross-category averages can be compared against the individual patterns for factual Q&A, code generation, long-form writing, summarization, and multi-turn conversations.
What this helps us decide
The benchmark is not trying to pick one model for everything. That would be too simple, and probably wrong.
A short chat request may care most about first-token latency. A developer tool may care more about streaming speed. A background summarization job may care more about cost. A security, network or SRE workflow may care about tail latency and data locality.
The right answer depends on the workload.
The axis we are not measuring: Intelligence
Everything above is a stopwatch and a token counter. None of it tells you whether the answer was any good. That is the deliberate hole in this benchmark, so it's worth filling in with someone else's numbers, if only so nobody reads a latency win as a quality win.
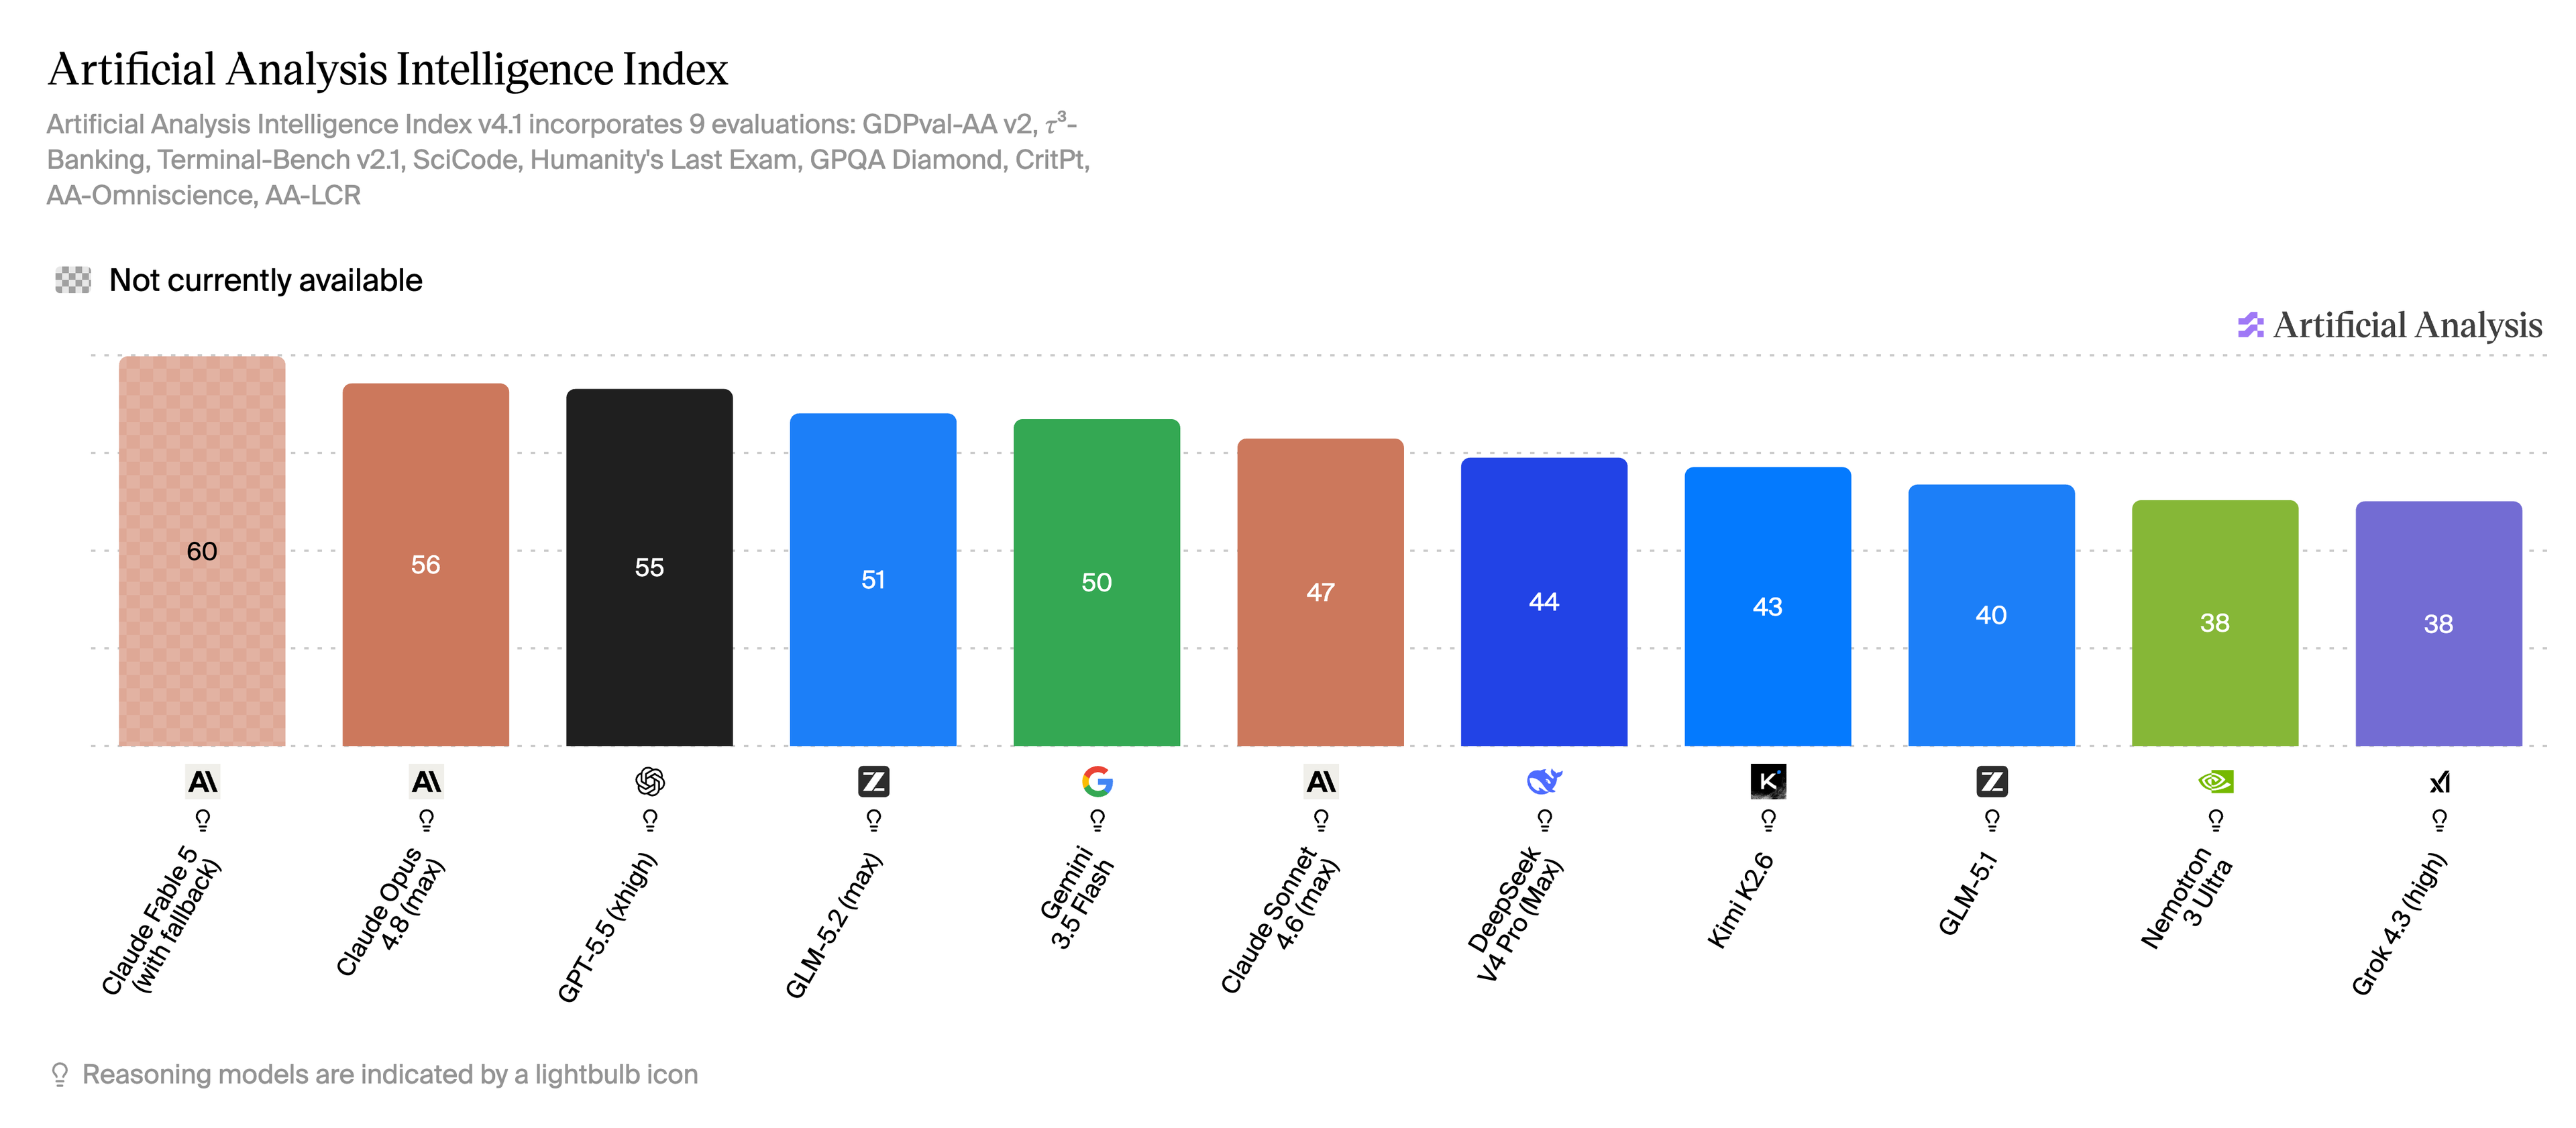
This is Artificial Analysis's Intelligence Index, an independent aggregate across nine evaluations. Two things are worth saying before the numbers. It measures the opposite axis to ours, quality rather than speed or cost. And it measures the opposite mode: these are the models running at full reasoning effort, the "max" and "xhigh" labels with the lightbulb icons, which is exactly the path we switched off to isolate the streaming path. So read this as the complementary chart, not a correction to ours.
On intelligence, the closed-source frontier still leads. GPT-5.5 sits near the top at 55, a step behind Claude Opus 4.8 at 56. GLM-5.1, the open-weights model in our run, lands at 40. If this were the only chart you saw, the story would be short and a little deflating for the open-source side.
But look at the pace. GLM-5.2, released while we were finalizing this article, scores 51. That is an eleven-point jump over GLM-5.1 in a single release, enough to leapfrog Gemini 3.5 Flash and Claude Sonnet 4.6 and land within four points of GPT-5.5. The open-weights model went from clearly behind the frontier to knocking on its door in the time it took us to write up a benchmark. NVIDIA's Nemotron 3 Ultra at 38 makes the same point from a different angle: the list of credible self-hostable models is growing by the month, not by the year.
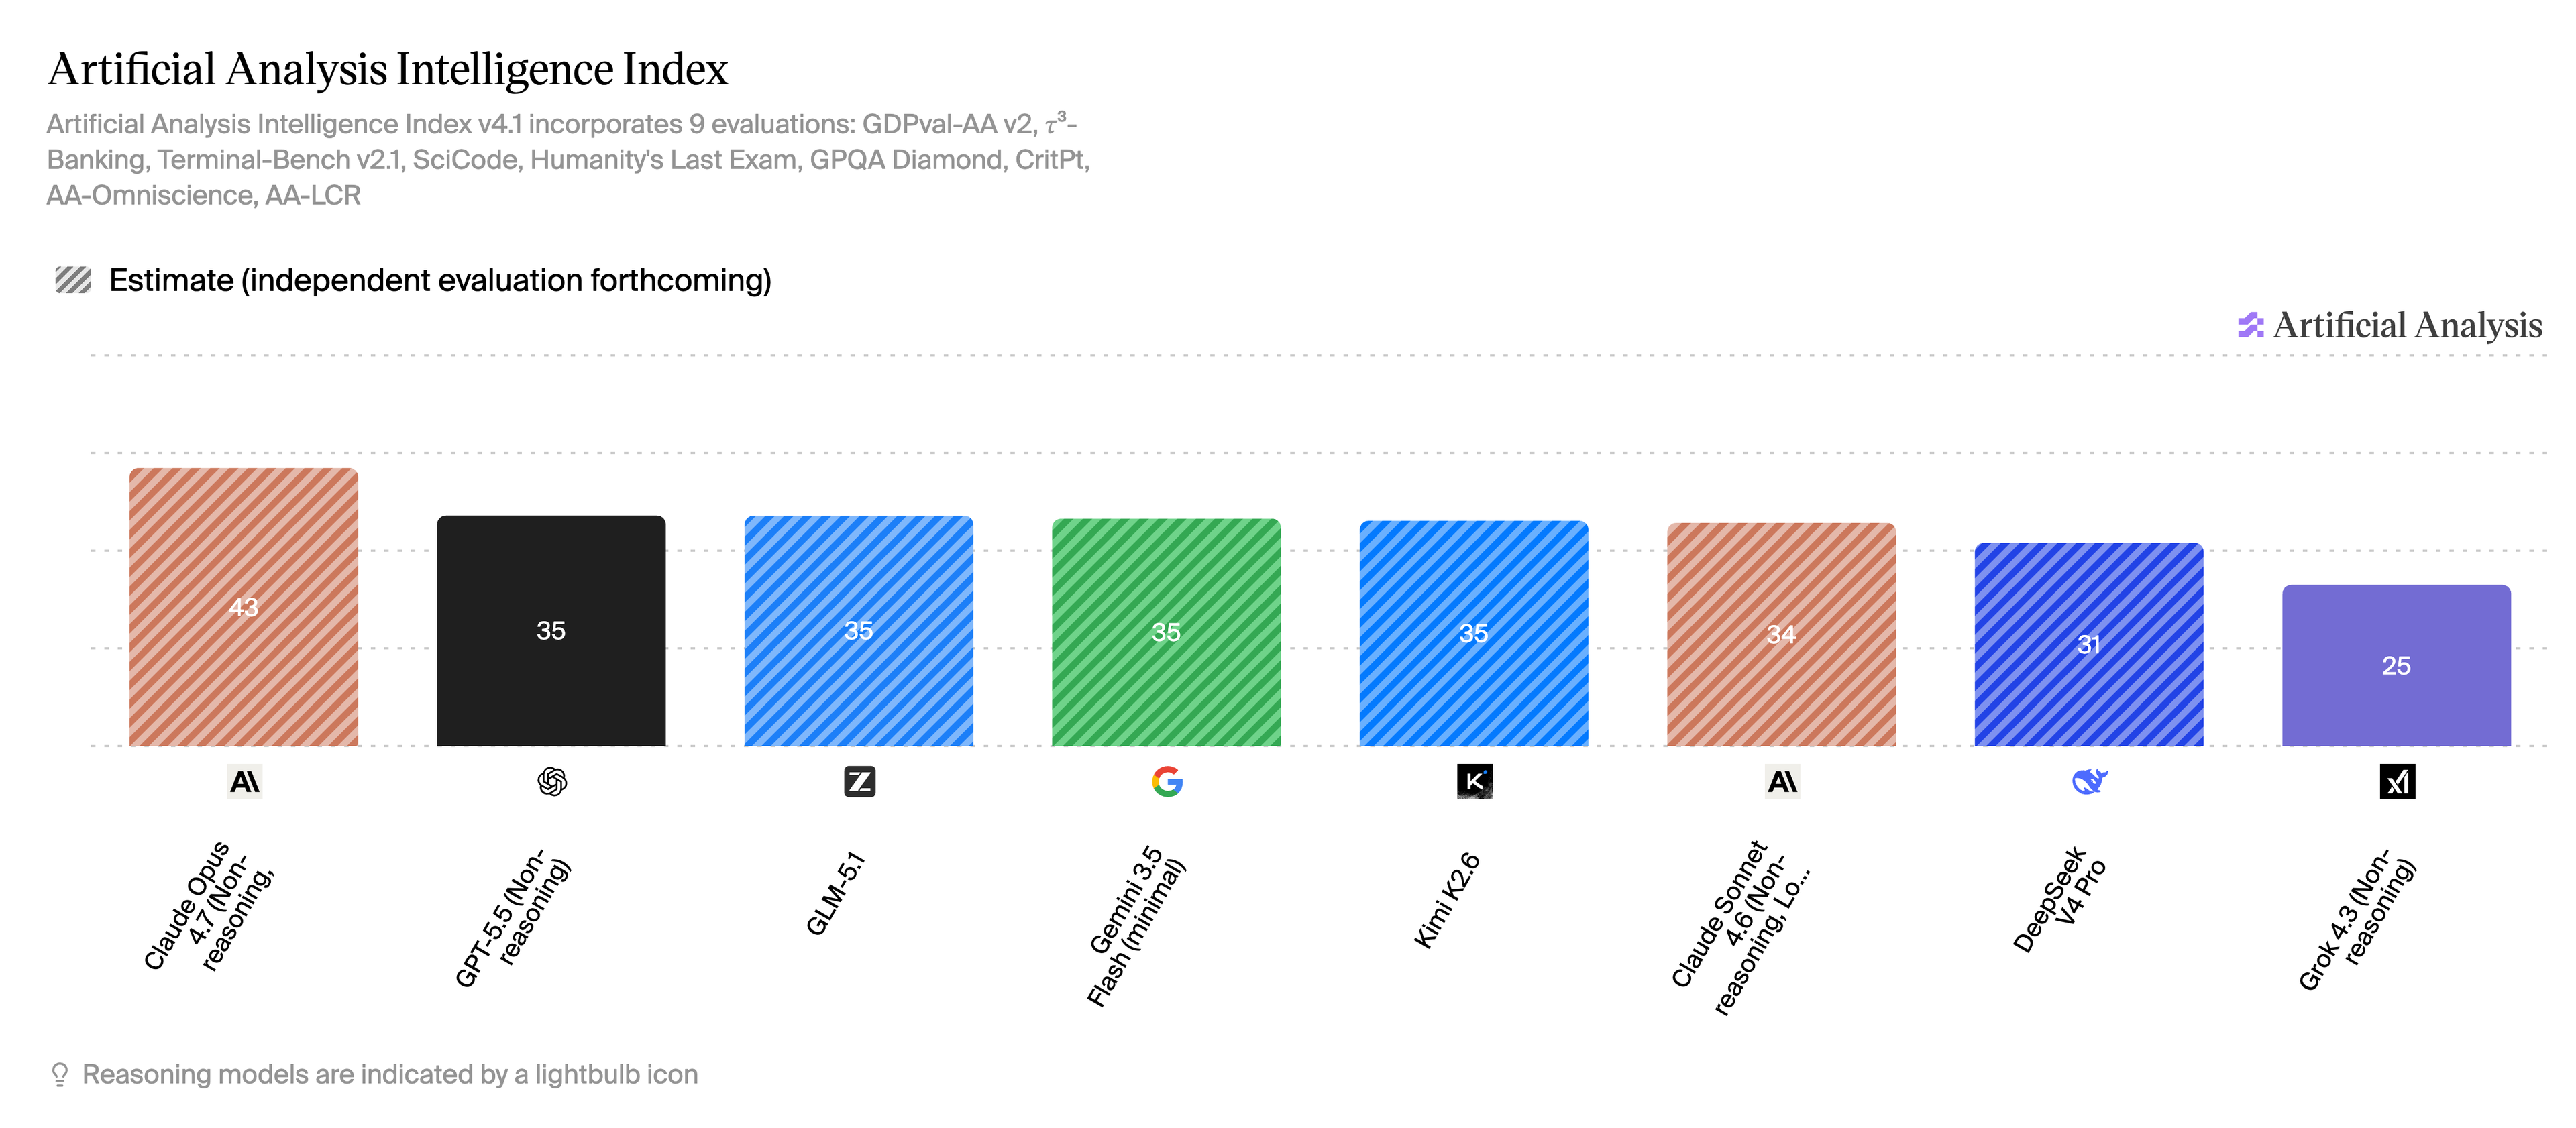
I also pulled the same view (below image) with reasoning switched off. The data is thinner here, and several points are estimates from Artificial Analysis, so it should be read with more caution. But the pattern shows us that without the extra reasoning pass, the field compresses sharply. The gap between closed frontier models and open or self-hostable alternatives is no longer a wide quality chasm; it's a much tighter race, with GLM-5.1, Gemini 3.5 Flash, Kimi K2.6, and GPT-5.5 mini all clustered around the mid-30s. That matters for our benchmark, because this is much closer to the operating mode we actually tested; fast, streaming and reasoning-off inference,
Looking ahead
That slope is also why this benchmark is not really about two models, but rather about having a way to plan what the next generation of Intility AI Compute and Intility Inference should look like, and to keep re-running the question as both sides of the stack move underneath us.
The GLM-5.1 numbers here came off NVIDIA HGX systems with H200 GPUs. That's a solid baseline for self-hosted inference on the Intility Cloud: how fast it starts, how it holds up under concurrency and what it costs against a hosted frontier model. But a baseline is only useful if you know which direction it's about to move, and right now it is moving in three:
More capable infrastructure
We are looking at extending the AI Compute fleet with newer NVIDIA Blackwell systems, including B300-class hardware. That buys headroom for larger models, longer context windows and higher throughput, and it lets us decide where a larger model actually earns its compute instead of treating size as a goal in itself.
The next wave of open-weights models
GLM-5.2 is already on the intelligence chart above, leading the open-weights field. It continues exactly the direction that made GLM-5.1 worth hosting: strong capability, open deployment, demanding workloads on infrastructure we operate ourselves. It was not part of this run, so we are making no claims yet about its latency, throughput or cost. We are testing it separately and will publish that in a follow-up.
A broader catalogue
Not every workload needs a large general-purpose model. Plenty are better served by something smaller or more specialized:
- embeddings for search and RAG (Qwen 3 8B is already deployed)
- rerankers for retrieval quality
- classifiers for routing and triage
- smaller chat models for high-volume, low-latency tasks
- domain-specific models where the task is narrow enough to justify one (several Whisper models are part of the model catalogue now)
These are less visible than the big chat models but often matter just as much in production, because they cut latency and cost and make the whole architecture easier to scale. In the same spirit we are watching models tuned directly for serving efficiency, like NVIDIA's Nemotron 3 Ultra. For operational work the fastest useful model often beats the largest one: something quick, predictable and cheap enough to use everywhere can unlock more real use cases than a heavyweight reserved for a handful.
Hot tip: for how we are actually building the inference platform underneath all this, read my colleague William Rom's article.
Closing thoughts
The key aspect of this benchmark is that we now have a repeatable way to ask important questions other than intelligence:
- Is this model fast enough for this workflow?
- Does it give us the sovereignty profile we need?
- Does the cost still make sense when the pilot turns into production?
The answers will not stay fixed. Models get better, prices move, infrastructure changes, and usage patterns shift.
That's fine. The goal is not to settle the question forever, but to keep measuring, keep learning, and choose the right tool for the job as the landscape changes.
More benchmarks to come!
if (wantUpdates == true) {followIntilityOnLinkedIn();}
Other Articles


Automation
March 5, 2026
Running AI Agents in Automated Workflows: What If Your Documentation Wrote Itself?

Benjamin Omar Joof