When UX Overheats
Have you ever cared so much about user experience that you've ended up turning your MacBook into a desk heater? I have. This is a story about how good intentions and a few lines of code can lead to a fork bomb.
The Developer Platform CLI
For our newly launched Developer Platform product, we are creating a developer-centric CLI tool to facilitate user interactions with the platform. This tool aims to streamline tasks like signing in, provisioning, and terminating Kubernetes clusters using simple commands like indev cluster create.
The CLI program is developed with the Go programming language and the popular Cobra framework. With Go, it is easy to cross-compile and ship small self-contained binaries to many architectures and platforms, making it a solid starting point for a program to run (or blow up as we'll see later) in a variety of environments. The Cobra framework also assists with managing command line arguments, flags, and I/O channels. A simple command may look something like this:
func NewLoginCommand(auth authenticator.Authenticator) *cobra.Command {
  var dcFlag bool

  cmd := &cobra.Command{
    Use:   "login",
    Short: "Sign in to Intility Developer Platform",
    Long:  `Sign in to Intility Developer Platform.`,
    RunE: func(cmd *cobra.Command, args []string) error {
      var options []authenticator.Option

      if dcFlag {
        devicecode := flows.NewDeviceCodeFlow(cmd.OutOrStdout())
        auth = auth.WithFlow(devicecode)
      }

      result, err := auth.Authenticate(cmd.Context())
      if err != nil {
        return redact.Errorf("could not authenticate: %w", err)
      }

      ux.Fsuccess(cmd.OutOrStdout(), "Authenticated as %s", result.AccountName)

      return nil
    },
  }

  cmd.Flags().BoolVar(&dcFlag, "device", false, "Use device code flow for browserless environments")

  return cmd
}
This is a simple example of a login command with an optional --device flag for authentication in browserless environments. There is something missing, though: we need to monitor how these commands perform over time.
Enhancing Observability in Our CLI
To build a reliable tool, we had to know what was happening under the hood. This is where the principles of Site Reliability Engineering (SRE) came into play. By defining Service Level Indicators (SLIs)—metrics such as command execution time and success rates—we could quantify our tool’s performance. Setting Service Level Objectives (SLOs) for these indicators meant we had clear targets to hit, like ensuring 99.9% of indev cluster create commands complete within two seconds.
In addition, we also define our error budgets. An error budget is a way of quantifying the amount of downtime or failures acceptable in a given period. For example, with an SLO requirement of 99.9% uptime, we have an error budget of ~43 minutes per month. We want our systems to be as reliable as possible, but we also want to move quickly and develop new features. The idea behind error budgeting is to help us strike a balance between these two goals.
Integrating OpenTelemetry for Better Insights
We decided to use OpenTelemetry for tracing and metrics, enabling us to easily correlate traces across all of our systems. This is particularly useful when debugging issues that span multiple components and services. The OpenTelemetry Protocol (OTLP) also prevents vendor lock-in by providing a standardized way to export telemetry data to various backends. In our case, we are using OpenTelemetry Collector to collect and export telemetry data to Elastic APM.
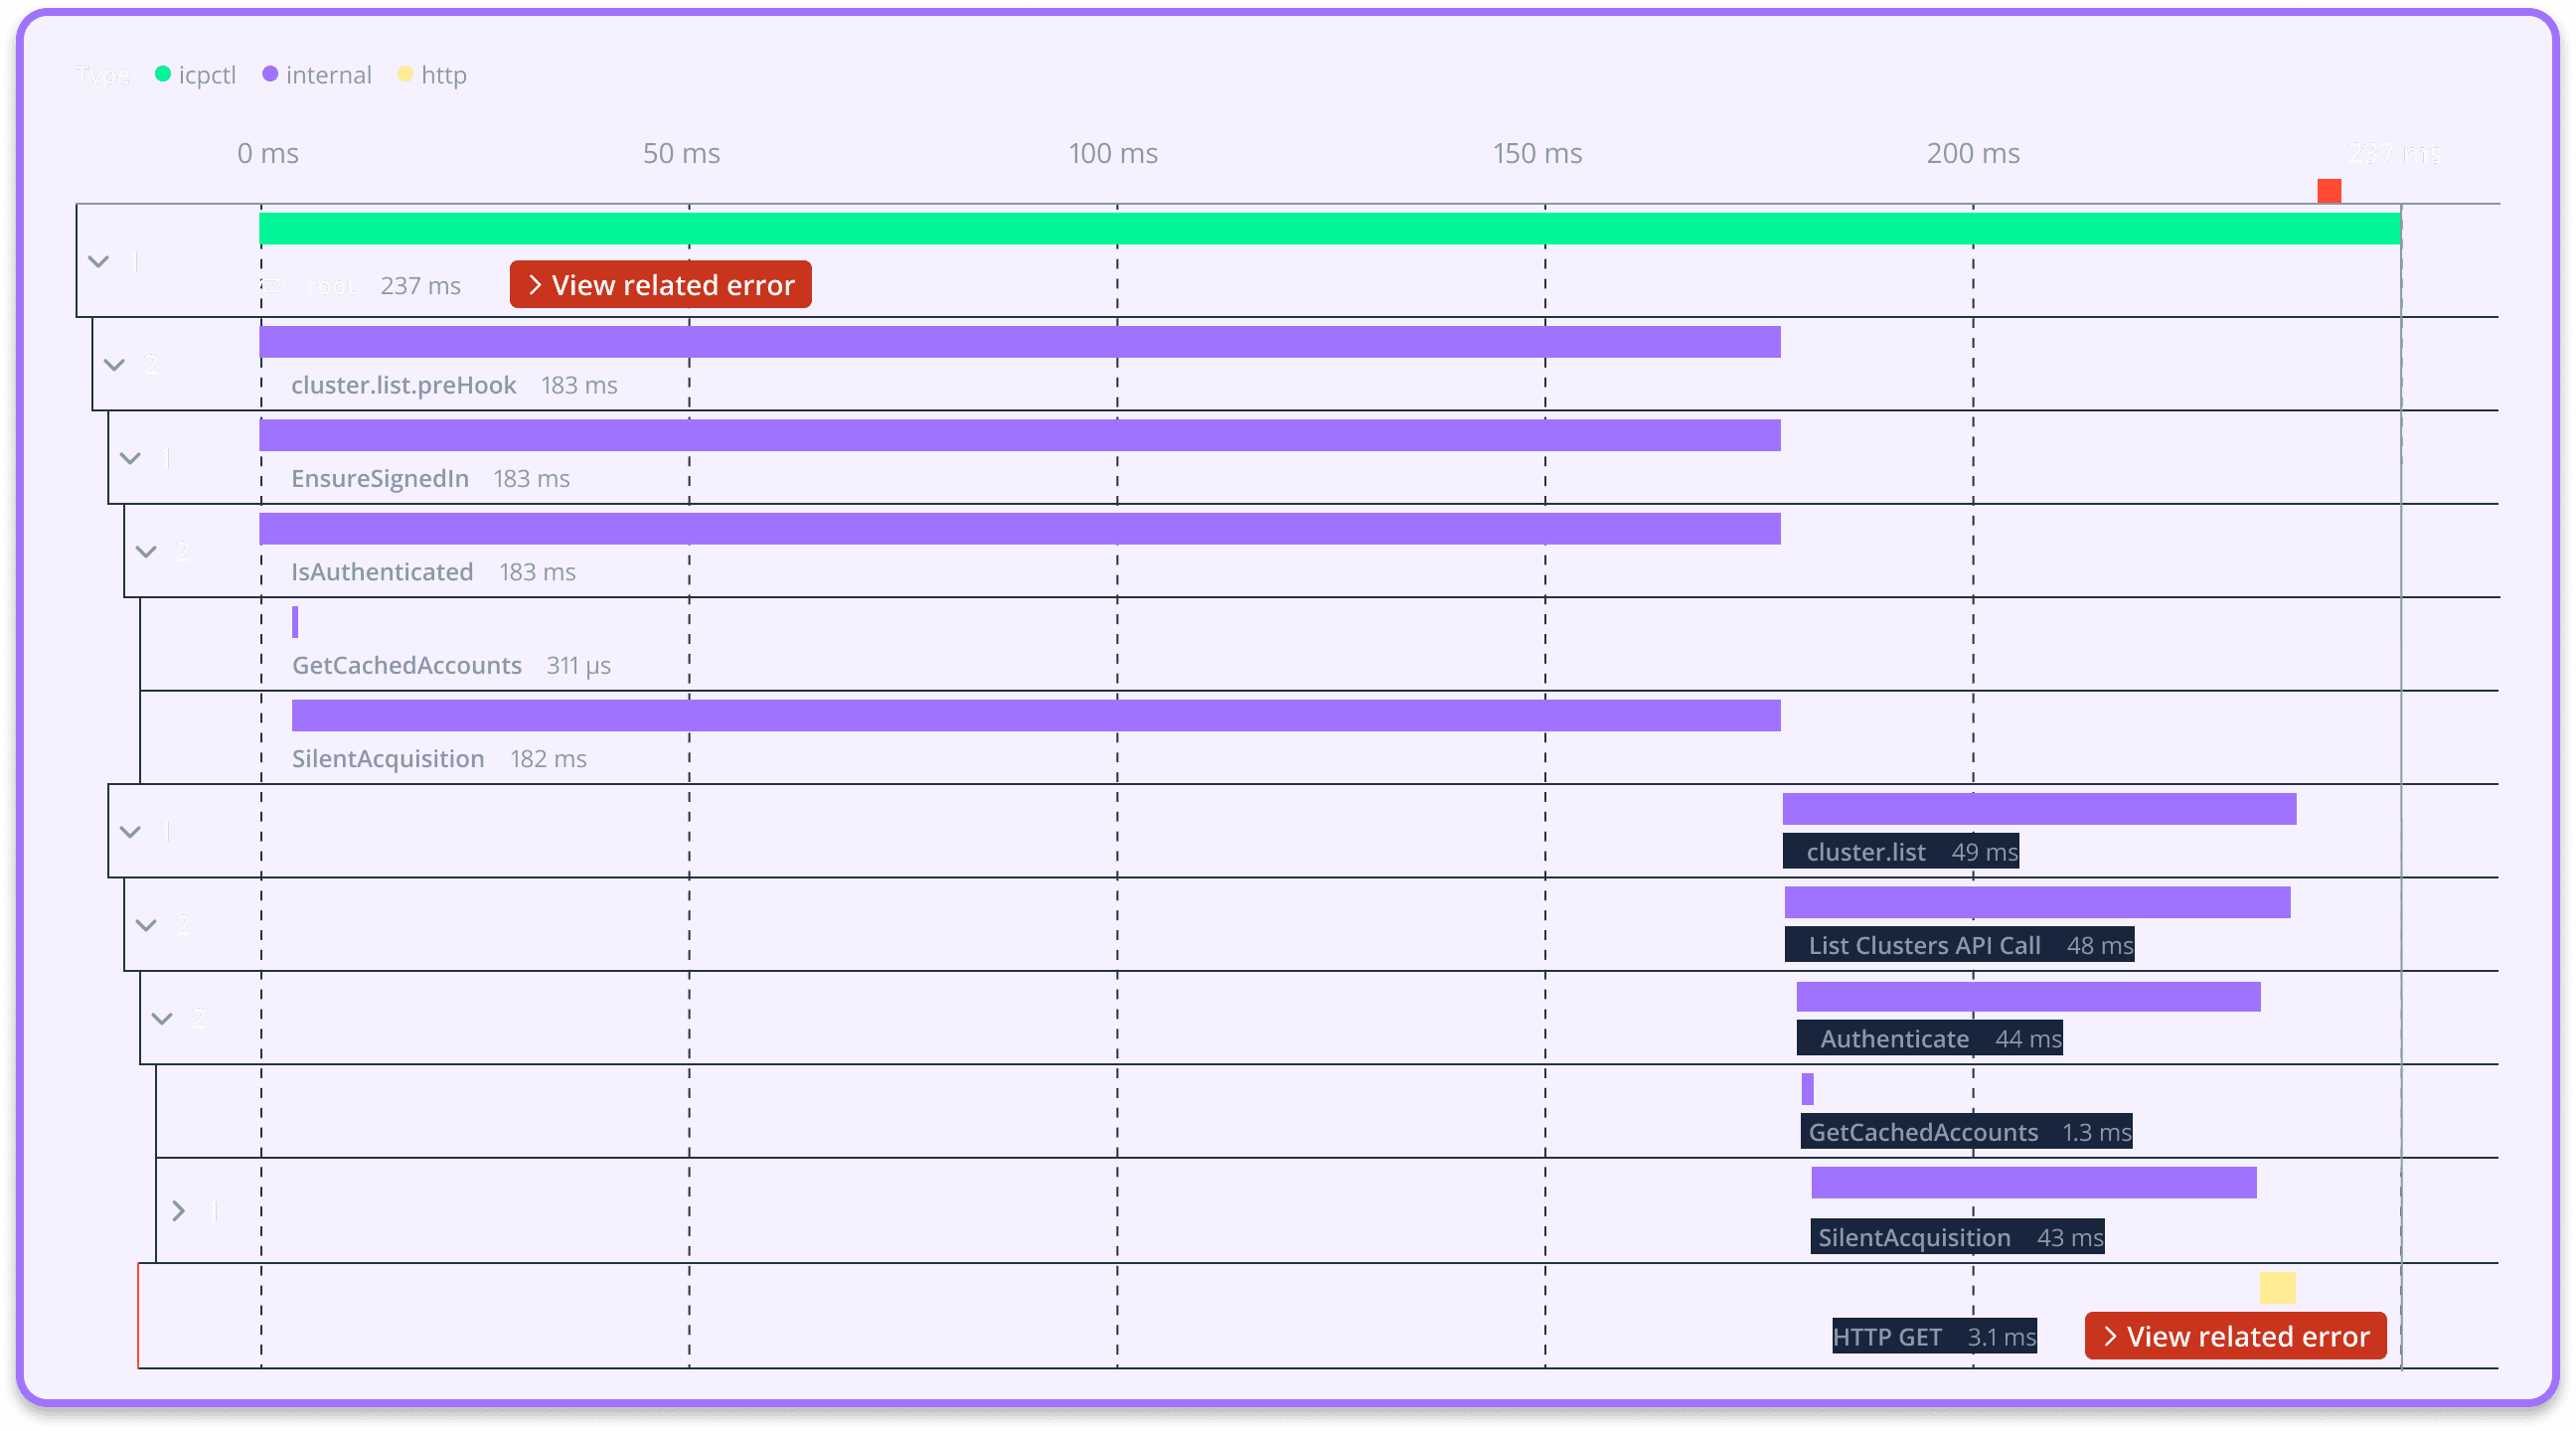
The Span and Event abstractions are used to track the execution of each command. A Span represents a single unit of work, while an Event captures a specific moment within that work. For instance, a Span might represent the execution of the indev login command, while Events within that Span could capture the time taken to acquire the access token, the success or failure of the operation, and any relevant metadata.
Finally, we're using the context.Context package from the standard library as a vehicle for Span propagation across the application layers, tying it all together. The previous login command can be extended with tracing and metrics as follows:
func NewLoginCommand(auth authenticator.Authenticator) *cobra.Command {
  var dcFlag bool

  cmd := &cobra.Command{
    Use:   "login",
    Short: "Sign in to Intility Developer Platform",
    Long:  `Sign in to Intility Developer Platform.`,
    RunE: func(cmd *cobra.Command, args []string) error {
      var options []authenticator.Option

      ctx, span := telemetry.StartSpan(cmd.Context(), "account.login")
      defer span.End()

      span.SetAttributes(attribute.Bool("device_code_flow", dcFlag))

      if dcFlag {
        devicecode := flows.NewDeviceCodeFlow(cmd.OutOrStdout())
        auth = auth.WithFlow(devicecode)
      }

      result, err := auth.Authenticate(ctx)
      if err != nil {
        return redact.Errorf("could not authenticate: %w", err)
      }

      ux.Fsuccess(cmd.OutOrStdout(), "Authenticated as %s", result.AccountName)

      return nil
    },
  }

  cmd.Flags().BoolVar(&dcFlag, "device", false, "Use device code flow for browserless environments")

  return cmd
}
Respecting the end-user
While our pursuit of insight is important, we must not forget the end-users' needs in the process. Few things are more frustrating than a program that slows down or, worse, fails to function because it's preoccupied with gathering and shipping usage data. To ensure that we don't compromise the user experience, we can distill the desired characteristics into the following tenets:
- Must respect user opt-out
- Must not ship PII (Personally Identifiable Information)
- Should gather only valuable data that supports our SRE efforts
- Should handle unreliable environments (slow/no internet connection)
- Must not interfere with the user experience
These principles impose some unique limitations for CLI tools. When I say the system must not interfere with the user experience, I mean, in technical terms, that it must not block the main thread or otherwise interfere with normal operation. In server-side systems, this is trivial to accomplish by spawning coroutines (or goroutines in Go terms) to perform such tasks on a background thread, or even better, scheduling the telemetry for batch upload at a later time.

In a short-lived program like a command-line tool, though, it's not as easy. Suppose we naively spawned a goroutine to upload telemetry while writing results to the screen. At best, we'd have a race condition between the terminal printing and the upload procedure. More likely, it would result in a faulty upload because the host process exits before the background job completes.
We could make the end-user wait for the upload to finish before terminating, but doing so would breach our commitment to not disrupt the user experience.
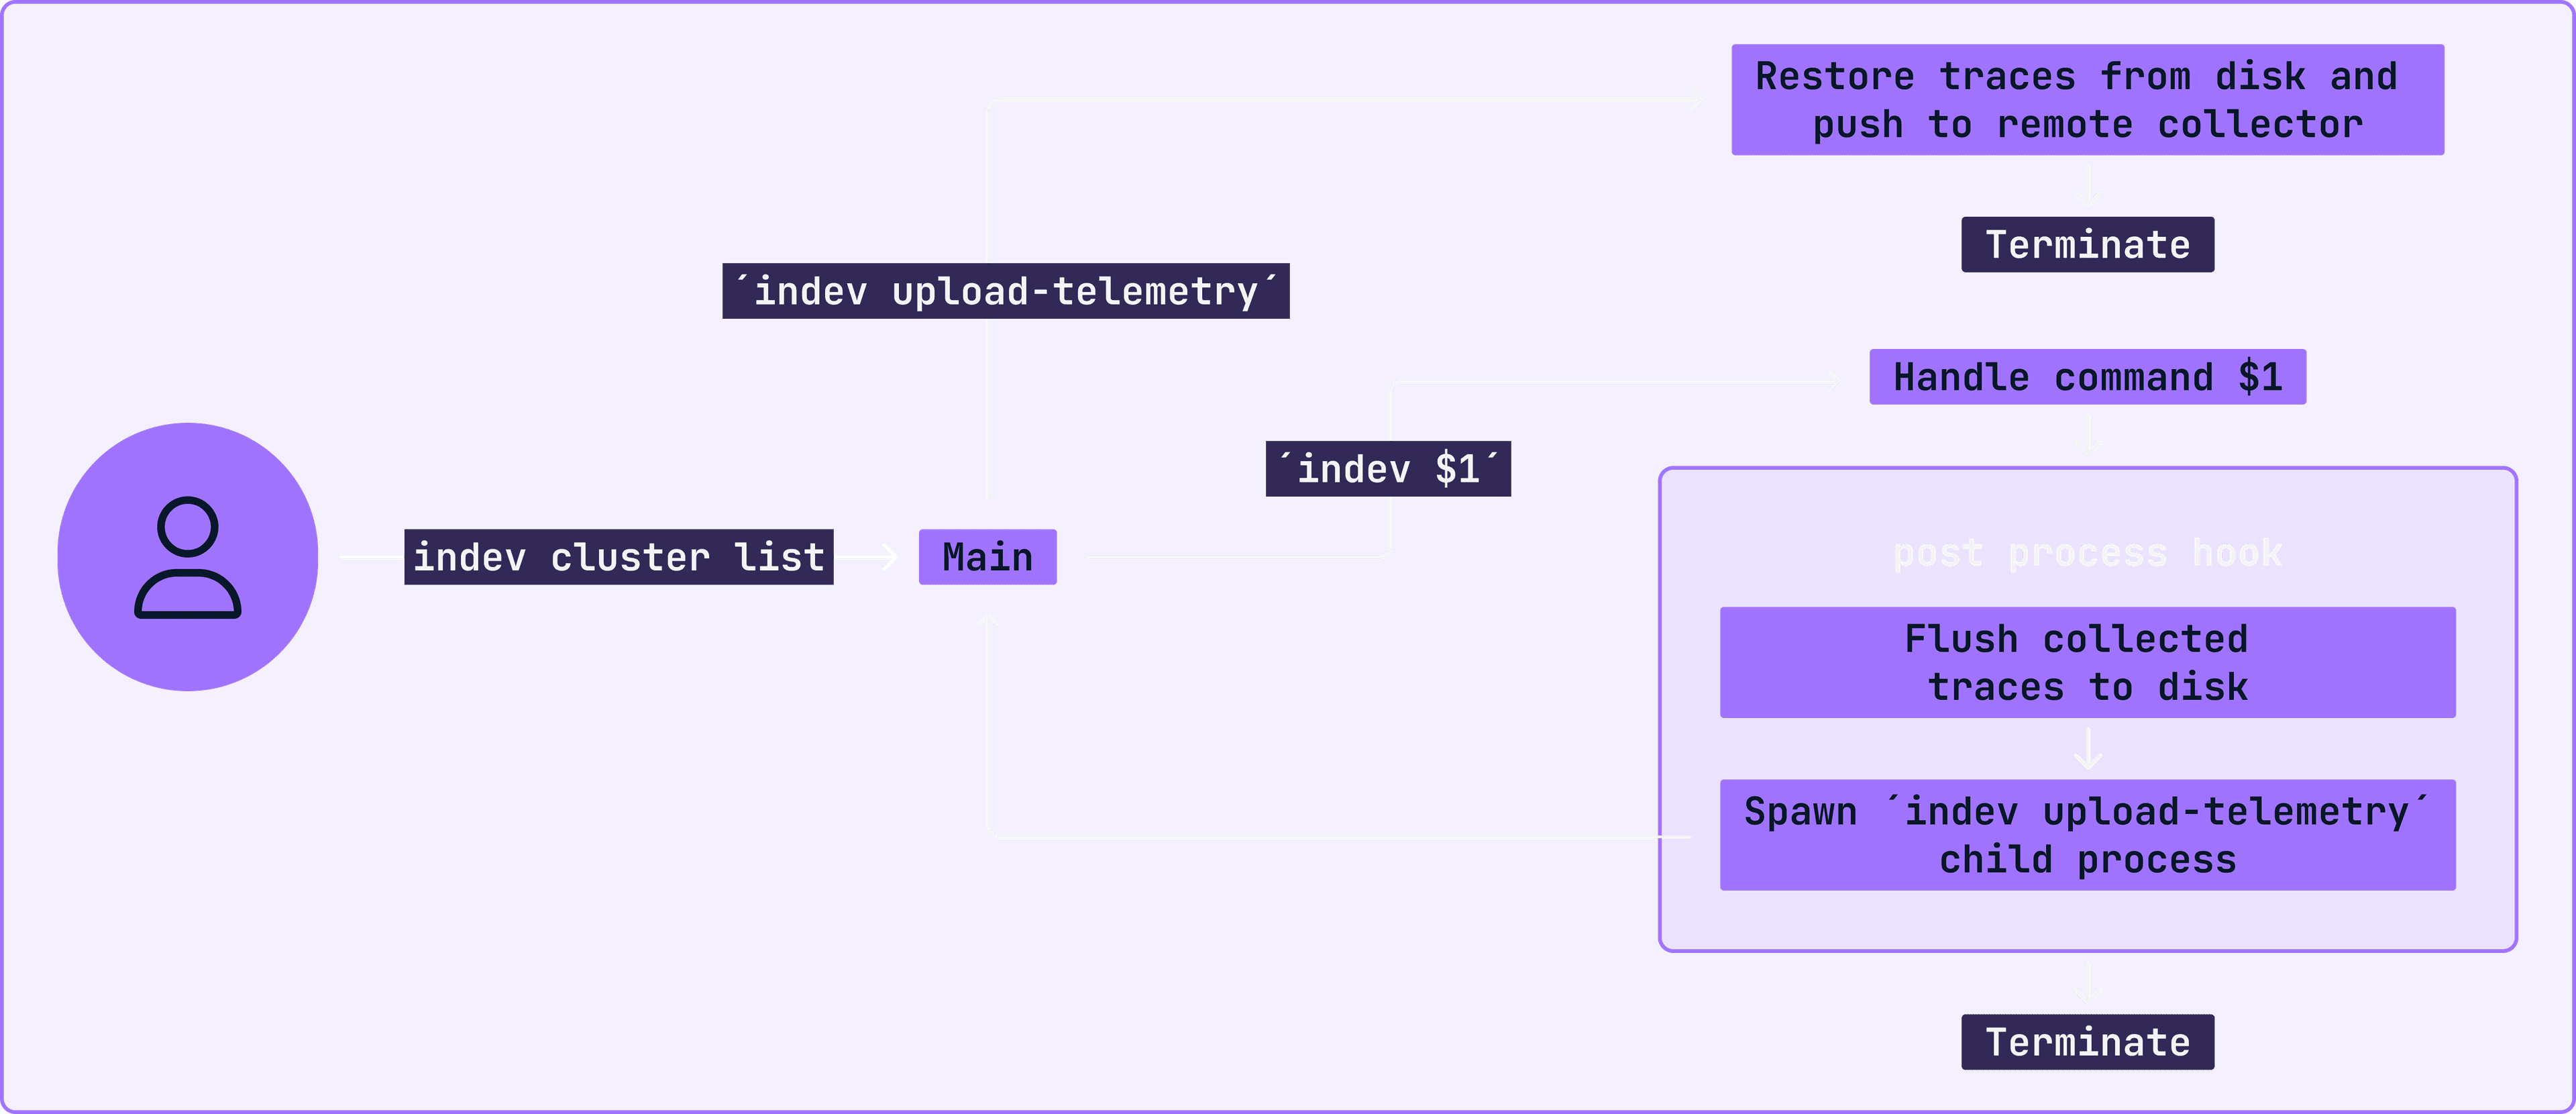
To address this, we need to separate the upload procedure from the main process by forking it, allowing the operating system to manage it as a child process that continues to run even after the main process terminates. However, to deploy this solution successfully, we must first resolve the issue that processes do not share memory. Thus, we need to flush the telemetry data to persistent storage, such as the file system, before forking our process. Conveniently, this also satisfies our reliability requirement by working as a cache mechanism when the remote collector is unreachable.
Now, after a lot of design work and some hours implementing the solution, we have something like this:

Disarming the footgun
Designing systems that recursively call themselves like this should make a developer's spider sense tingle. It's quite possibly the epitome of a footgun. One wrong step, and we have a self-replicating entity that never ceases to reproduce. Being aware of this pitfall, it is quite simple to implement a safeguard to ensure we don't fork the forks:
const uploadTelemetryCommand = "upload-telemetry"

func main() {
    // ...

    scheduleTelemetryUpload(ctx, os.Args)
}

func scheduleTelemetryUpload(ctx context.Context, args []string) {
  // prevent fork-bomb
  if len(args) == 0 || args[0] == uploadTelemetryCommand {
    return
  }

  self, err := os.Executable()
  if err == nil {
    _ = exec.CommandContext(ctx, self, uploadTelemetryCommand).Start()
  }
}
I double-checked the logic and potential typos, and it was time for a real-world test. Feeling confident in my abilities, I opened the terminal and ran indev cluster list...
Footgun still loaded
The most observant among you may spot the issue with the snippet above. Let me give you a hint: args[0]. The first argument always holds the name of the executable, not the first user-provided argument. In this case, it would be "indev," not "upload-telemetry."
But it was too late for me now; the command had already executed. Immediately, my machine's came to a grinding halt. The disk I/O went through the roof and, unlike my program, I started to panic. With sweaty hands, I attempted to regain control of the madness by killing the processes, but they were too fast. In rapid succession, each process forked itself and terminated, only to have another one spawn, fork, and terminate ad infinitum. It was like playing an impossible game of whack-a-mole in a fast-forward circus, except the moles were processes, and I was the clown. Even the process monitor struggled to keep up with the flood of PIDs. Meanwhile, the fans went brrrrrrrr, as if mocking my new wig and ever-tightening bow tie.
Let me just say, for an enterprise full stack dev like me, it's a novel experience to actually feel the physical heat of my mistakes.
Finally, defeated by my own creation and unable to stop its cancerous procreation, I had to reach for the ultimate circuit breaker—the infamous "Swedish button." For those unfamiliar with Norwegian colloquialism, it's the you-done-goofed button often located on the right-hand side below the screen.

Aftermath
After regaining control of my machine, I immediately started sifting through the debris. Lo and behold, the ordeal left me a trail of traces on disk that failed to upload.
ls -l ~/Library/Application\ Support/indev/traces | wc -l
17245
And there we have it— ~17k files painfully proving commitment to user experience. With my current confidence level I couldn't muster the courage to `rm -rf` those, lest I perforated my foot with a second hole.

After cleaning up and fixing the bug, we now have a robust piece of software. It can collect valuable information about the tool's performance and behavior on the user’s machine while respecting opt-out preferences. Additionally, we can establish long-term SLO's that effectively track trends and error budgets, even in the face of flaky internet connections or other uncontrollable factors. All of this without degrading the user experience. That's a success in my book.


if (wantUpdates == true) {followIntilityOnLinkedIn();}

